
eBay Market Signals
 Click to expand
 - Client
- Internal Product - Algorithmic
- Industry
- E-commerce Intelligence
- Location
- Global
- Year
- 2025
- Stack
- Python, Scrapy, PostgreSQL, Redis, Airflow, React, Webflow
eBay processes millions of active listings across thousands of categories. Prices shift mid-day, search rankings rearrange hourly, and competitors adjust to demand signals most sellers never see. Professional sellers managing hundreds or thousands of SKUs face a structural disadvantage, since the ones who react fastest to pricing shifts, competitive entries, and demand signals capture disproportionate margin while everyone else works on instinct, spreadsheets, and data that aged out before the morning was over.
We built Indications to close that gap. The platform extracts market data at scale, structures and normalizes it with AI-driven parsing, and delivers action items through dashboards, alerts, and API access, all while staying invisible to eBay’s detection systems.
The problem
eBay’s public APIs offer limited coverage, its anti-bot infrastructure actively blocks external collection, and listing formats vary so widely that cross-seller comparison is impossible without heavy normalization. Discovery with a seller community whose data needs had outpaced their tools surfaced three connected challenges.
The first is detection and access control. eBay flags automated access within hours through predictable request intervals, consistent IPs, and uniform browser fingerprints, so operating continuously at high volume without tripping those defences is an engineering problem before it is a data problem.
The second is data heterogeneity. The same product from five sellers appears with five title formats, attribute structures, and pricing conventions, so comparable data needs parsing and normalization that accounts for the inconsistency at scale.
The third is coverage and freshness. Sellers need three views, search rankings, product-level detail, and storefront-level intelligence, each with its own collection strategy, and the data loses value within hours.
 Click to expand
 The approach
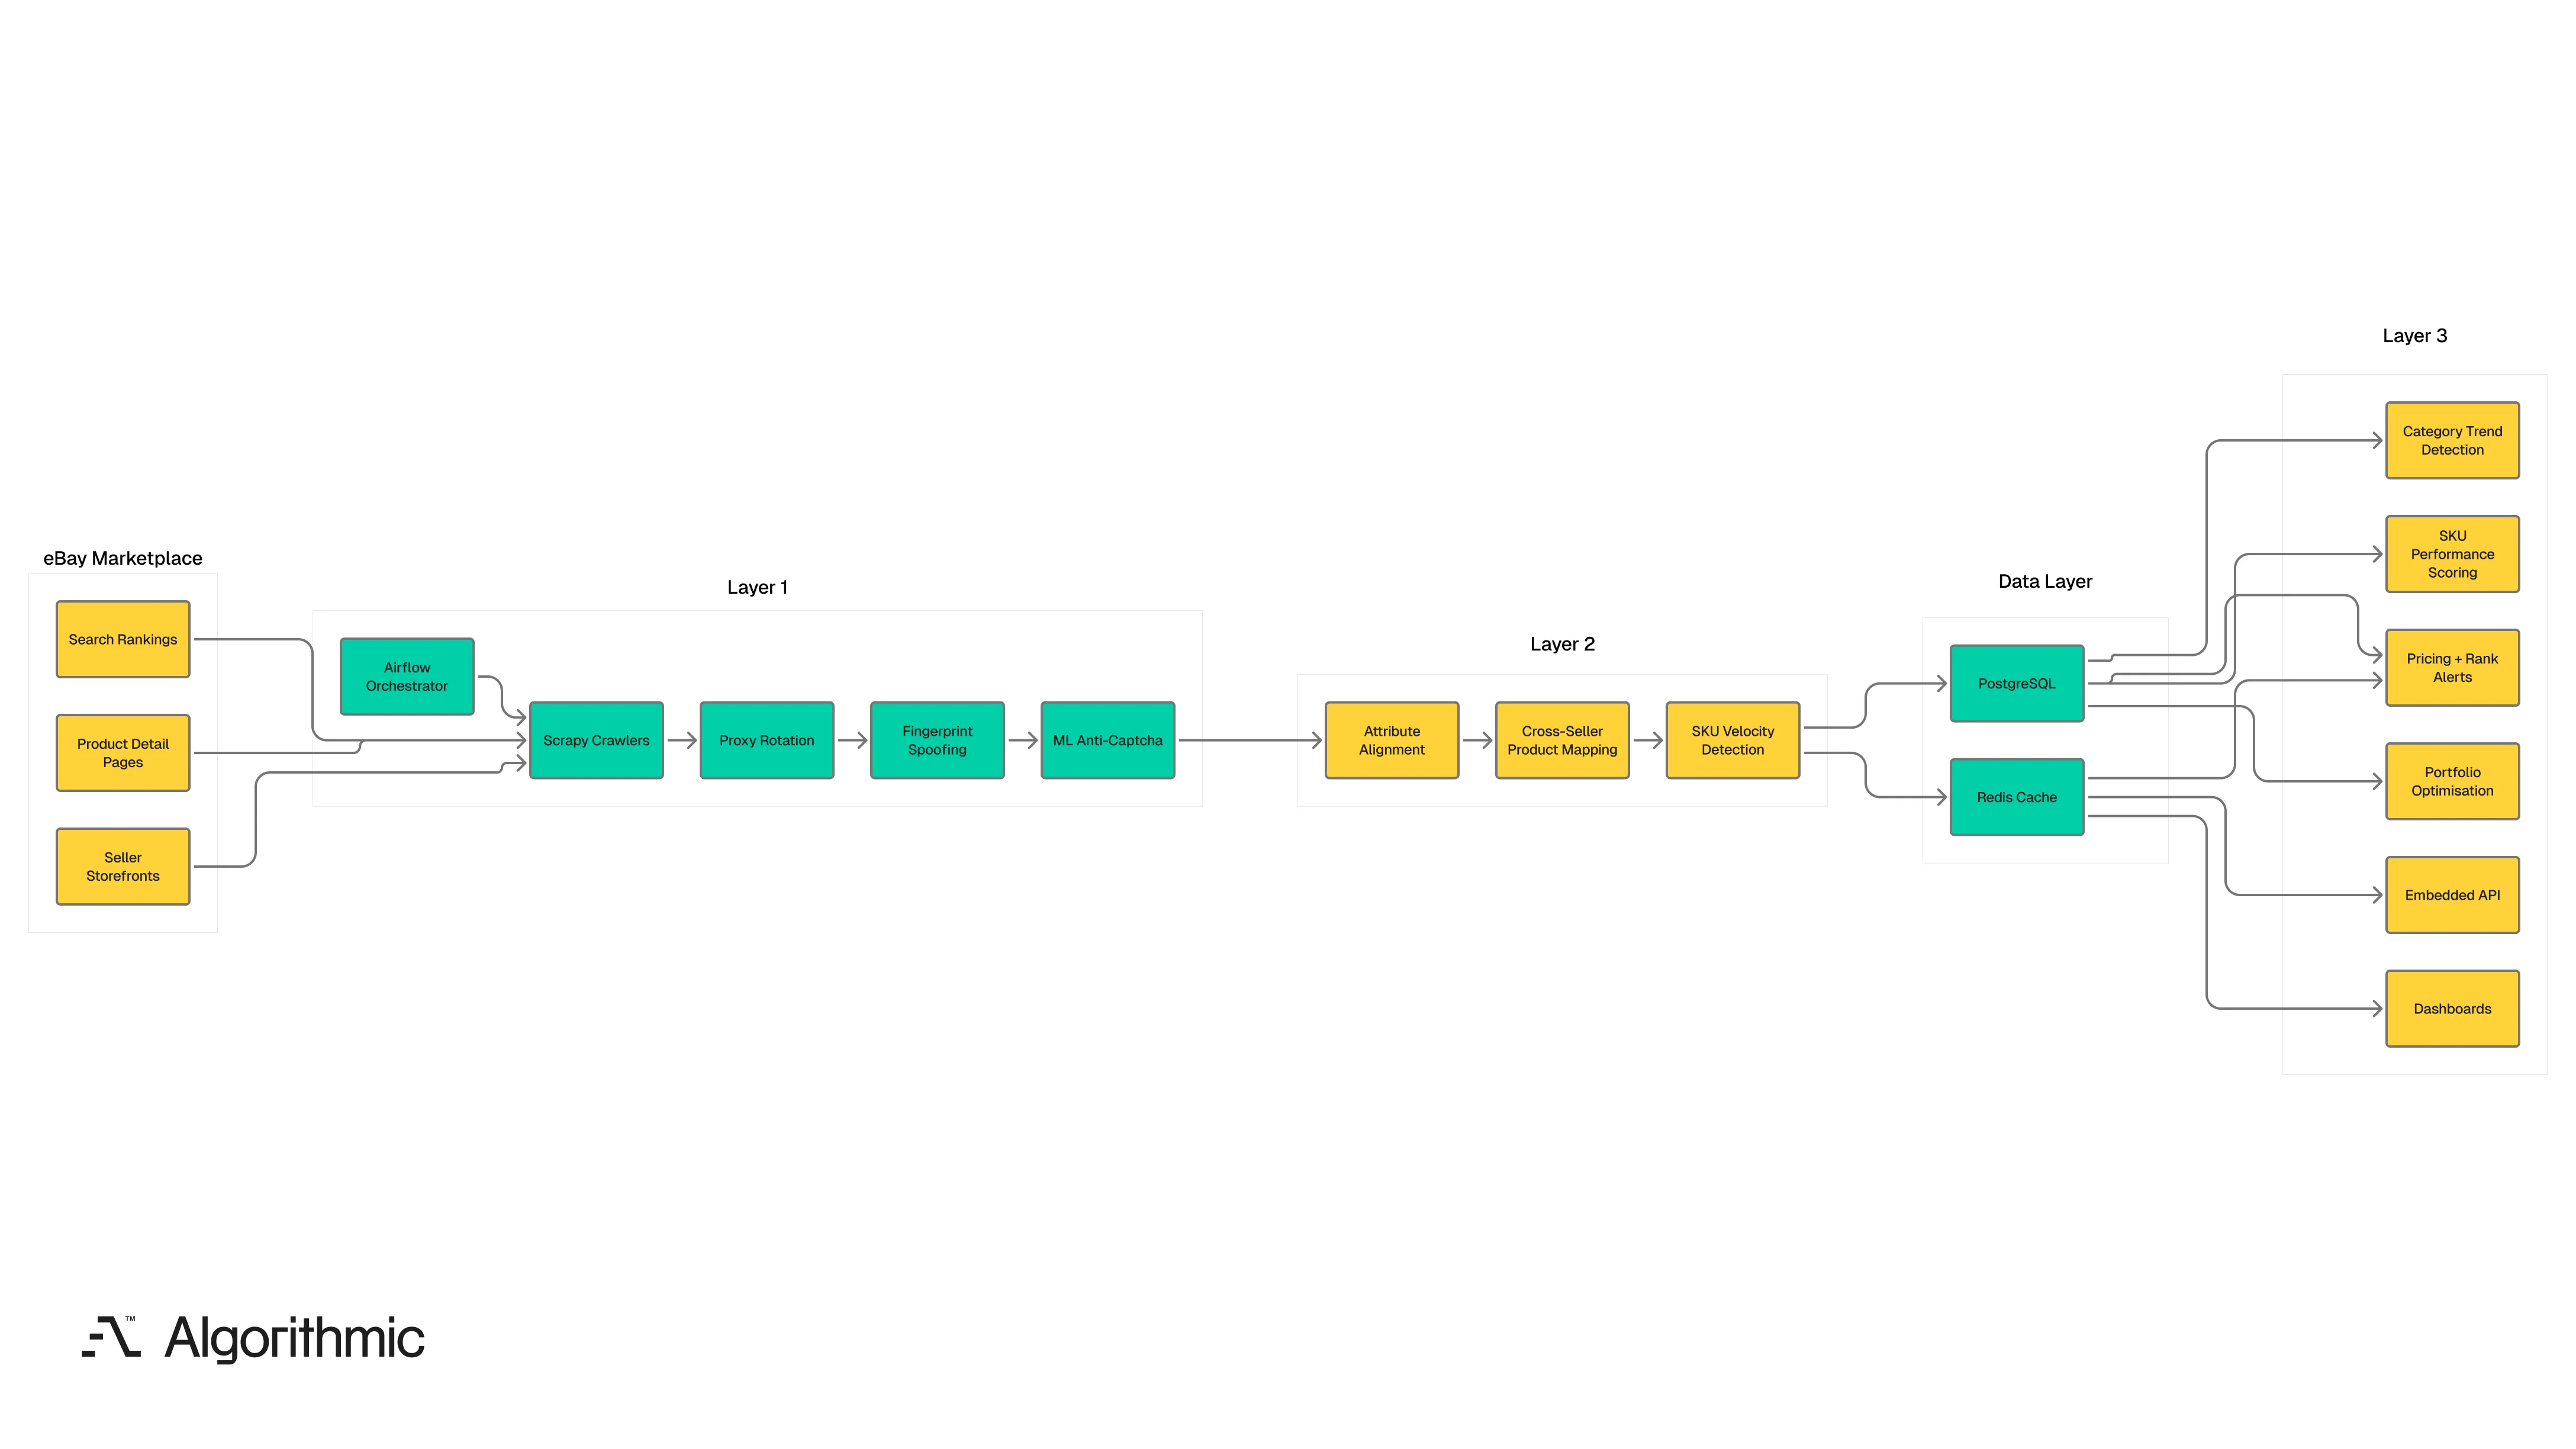
The platform is three connected layers, and the first two address access and heterogeneity.
Stealth data acquisition runs across three collection tiers, search, product, and storefront, each with its own crawling logic, frequency, and evasion. Session-aware IP rotation cycles through blended ISP and residential proxy pools with randomized patterns, and the blend ratio shifts with per-session detection-risk signals. Fingerprint management varies user agents, viewport, interaction timing, scroll behavior, and JavaScript execution so each session looks organically distinct, while ML-based captcha solvers resolve challenges in-flow without breaking session continuity. Airflow orchestrates the crawl schedule - job sequencing, retry logic, and pipeline state from raw HTML to normalized output - with awareness of rate limits, detection thresholds, and source-specific crawl windows. The result is continuous, high-volume collection around the clock with uninterrupted access throughout the engagement.
AI-driven normalization then turns structurally inconsistent listings into comparable records. Attribute alignment maps inconsistent fields into a unified schema, resolving equivalents such as “color” versus “colour” or free-text versus structured fields. Cross-seller product mapping links listings that represent the same underlying product even when titles, images, and attributes differ, which is the apples-to-apples comparison sellers had been attempting by hand. SKU velocity detection tracks inventory changes and listing turnover across poll cycles to surface which products are selling, how fast, and whether velocity is accelerating.
The build
The intelligence layer turns normalized data into decisions, with each tool shaped around workflows sellers described in discovery. Pricing alerts fire when competitors reprice tracked products, when rank positions cross configurable thresholds, or when new competitors enter a category, with the lag from change to notification measured in minutes. SKU performance scoring rates each product against live benchmarks - pricing competitiveness, rank trajectory, estimated margin against category averages, and sales-velocity percentile - and surfaces underperformers automatically. Category trend detection tracks search volume, new-listing rates, and price movement to catch emerging demand before it appears in eBay’s public trending data. Portfolio optimization synthesizes pricing, ranking, velocity, and margin into concrete suggestions: which SKUs to reprice, where to add inventory, which categories to enter, and which products to discontinue. From a listing change on eBay to an action item in a seller’s dashboard, the full pipeline completes in minutes.
The platform serves two user profiles. Dashboard users get responsive, mobile-friendly interfaces for pricing, rank movement, competitor activity, and portfolio health, with an information architecture designed in Figma around scan-ability, since professional sellers check throughout the day and need pattern recognition at a glance. Larger sellers running their own pricing engines, inventory systems, or analytics tooling integrate the same data programmatically through embedded API endpoints.
Every technology choice reflects a specific tradeoff:
| Layer | Technology | Why We Chose It |
|---|---|---|
| Scraping Engine | Python, Scrapy | Concurrency model and middleware flexibility handle multi-tier crawling at this volume |
| Orchestration | Airflow | DAG-based scheduling with retry logic and pipeline state across hundreds of crawl jobs |
| Primary Database | PostgreSQL | Relational complexity of listings, rankings, seller profiles, and time-series pricing |
| Caching | Redis | Sub-second reads for dashboard queries and real-time alert evaluation |
| Anti-Bot Stack | ISP/residential proxies, fingerprint spoofing, ML captcha solving | Layered evasion for sustained, high-volume access |
| Frontend | React, Webflow | React for interactive dashboards, Webflow for marketing and onboarding |
| Design | Figma | Component-based design system for information-dense interfaces |
Outcomes
| Outcome | Detail |
|---|---|
| Time-to-insight | Weeks to minutes |
| Seller ROI improvement | Double-digit, driven by pricing and portfolio decisions |
| Trend reporting | 90-day historical analysis by product, seller, and category |
| Data freshness | Continuous polling with near real-time alert delivery |
| Detection incidents | Zero, sustained uninterrupted access throughout operation |
Market intelligence that once took weeks of manual effort now arrives in minutes, and sellers reported shifting from reactive to proactive within the first month. Those using the platform reported double-digit ROI from data-informed pricing and portfolio decisions, 90-day trend reports by product, seller, and category became a core input to quarterly planning, and pricing, inventory, and category-entry decisions now rest on current data rather than outdated snapshots. Access stayed uninterrupted with zero detection incidents throughout operation.
Indications shows what becomes possible when data-acquisition engineering, AI-driven normalization, and domain-specific intelligence design come together as one platform. The same pattern - stealth-grade acquisition, heterogeneous-source normalization, and operationalized intelligence - applies wherever valuable market data is fragmented, inconsistently structured, and access-controlled, from competitive intelligence to pricing optimization across e-commerce, logistics, and financial services.
We built Indications on Algorithmic’s data infrastructure and integrations practice - high-throughput ingestion, orchestration, and cross-system normalization - paired with a web application and API layer designed for information-dense professional workflows.