NCAA Betting System
 Click to expand
 - Client
- Maverick Sports Group
- Industry
- Sports Betting
- Location
- United States
- Year
- 2025
- Stack
- Python, PostgreSQL, AWS, XGBoost, Neural Networks, Docker
College basketball sits in an unusual spot in the betting market. Over 350 Division I programs each carry distinct playing styles, coaching philosophies, and recruiting pipelines, rosters turn over every year as players graduate, transfer, or declare for the draft, conference realignment reshapes schedules, and a single-elimination tournament of 67 games in three weeks amplifies variance beyond what regular-season data can account for.
That makes the market less efficient than professional leagues, because the volume of teams and the pace of roster change make it hard for oddsmakers to hold precision across every matchup. The information asymmetry is real in a way it is not in a 30-team league, and the difficulty is engineering that information into concrete signal before the market absorbs it.
We built a predictive platform for those constraints. It ingests multi-source data in near real time, engineers features that capture context standard models miss - travel logistics, venue hostility, rivalry intensity, rolling form - and deploys models gated on profitability. The pipeline is modular, so the same architecture adapts to other sports and non-sports prediction domains.
The problem
Three structural characteristics guided the architecture.
Over 350 programs means thousands of possible matchups, many between teams that have met once in three years or never, so we cannot lean on head-to-head history the way a 30-team league with repeated matchups allows. The feature engineering compensates by modeling stylistic similarity, conference-level patterns, and transferable performance metrics.
College rosters change substantially every year, and a team’s identity - offensive system, defensive tendencies, depth, chemistry - resets with each incoming class and transfer-portal cycle. Prior-year statistics carry forward imperfectly, so the system adapts its read on each team continuously through the season rather than relying on preseason or prior-year data.
Rivalry games, hostile venues, and elimination pressure produce performance variation that box-score statistics cannot capture. A team that is steady in conference play can behave differently in a rivalry game with a hostile crowd or a single-elimination tournament game, so we dedicated specific feature engineering to those contextual signals.
 Click to expand
 The approach
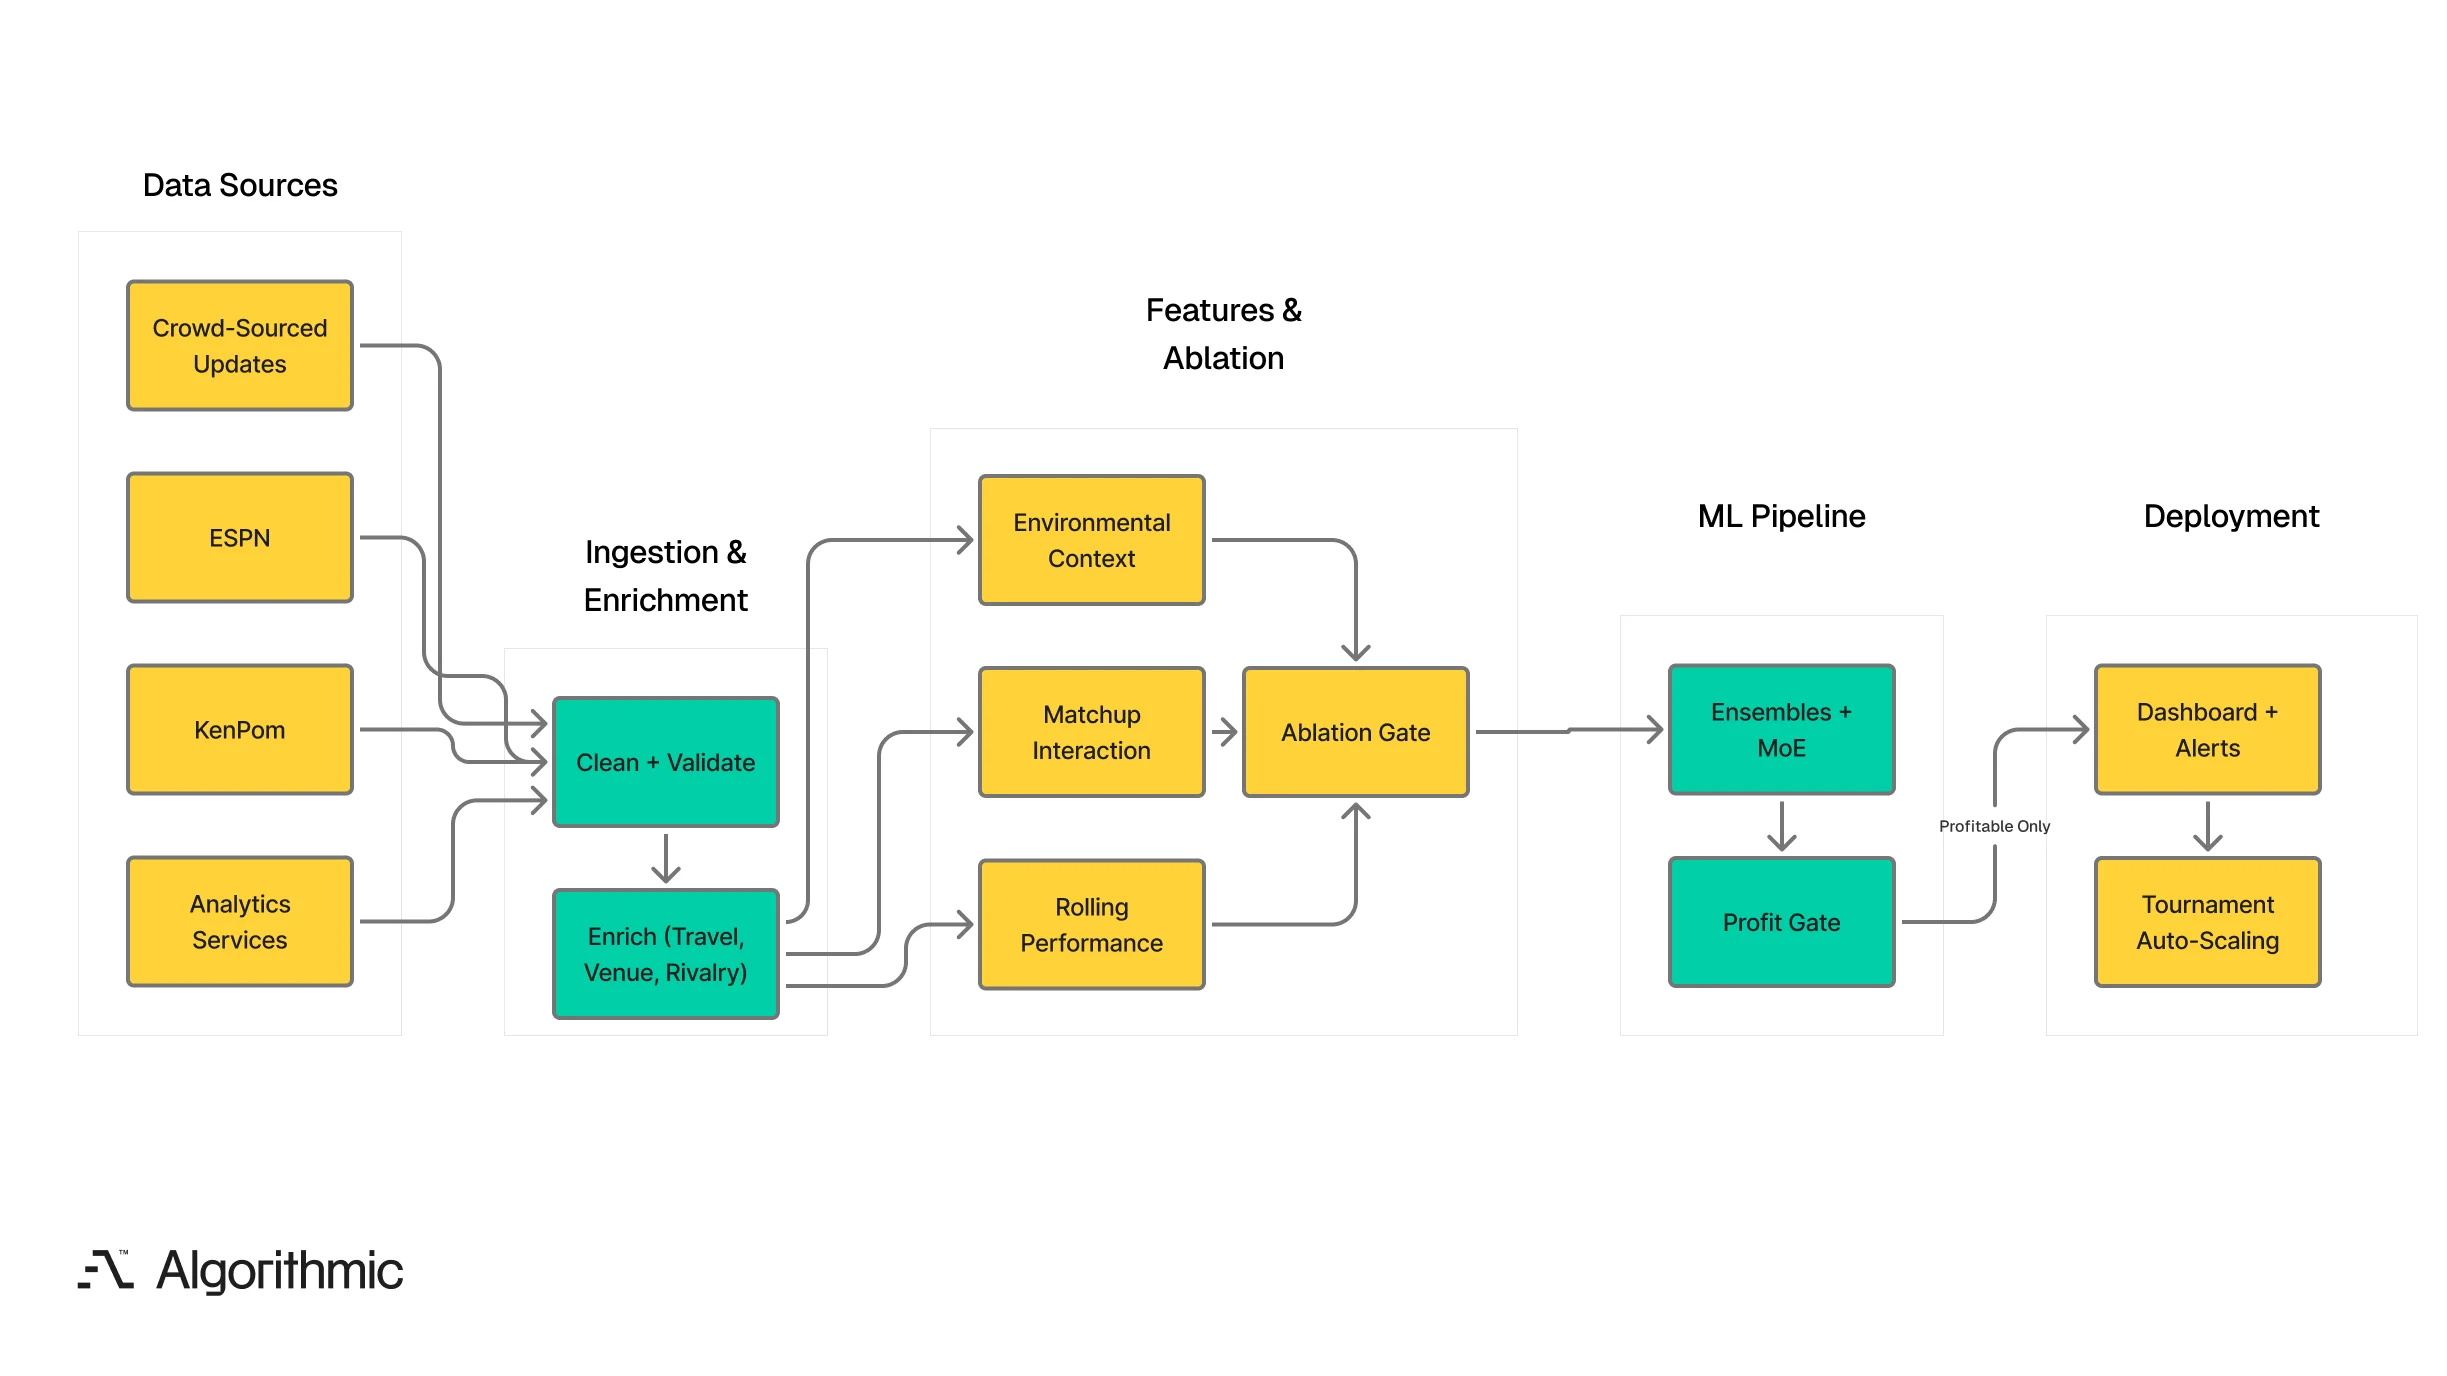
A multi-source ingestion engine pulls from four kinds of source. ESPN provides scores, schedules, and box-score statistics as the structured baseline, KenPom adds tempo-adjusted efficiency metrics that normalize for pace and strength of schedule, specialized analytics services contribute advanced models and proprietary ratings, and crowd-sourced updates surface injuries, transfer-portal activity, and roster changes that formal channels report with delay. The pipeline cleans and validates the data in near real time, stores structured records in PostgreSQL, and enriches every game with three kinds of context: travel logistics such as distance, direction, time-zone changes, and days since the last game, venue attributes like capacity, altitude, surface, and home-away differentials with hostility scored from historical upset rates and margins by venue, and rivalry context drawn from series history, conference rivalries, tournament history, and regional proximity, quantified as a continuous feature rather than a binary flag.
Features are engineered across three categories, and every one goes through ablation testing. If a feature improves accuracy but not profitability against historical lines, it is removed, because an accurate model that loses money against market odds is worse than no model. The first category is rolling form, offensive and defensive efficiency, pace, and shooting computed on configurable 5-, 10-, and 20-game windows, since recent form gives more current signal than season-long averages when injuries or coaching changes shift a team’s identity. We also track the divergence between rolling metrics and season averages, where a team whose 5-game efficiency is falling while its season average holds high carries risk the surface numbers hide.
The second category is synergy. Rather than categorical labels, we quantify how two teams’ styles interact as continuous scores across tempo compatibility, rebounding-style interaction, turnover tendency versus defensive pressure, and three-point reliance versus perimeter-defense quality, each capturing matchup dynamics that aggregate statistics miss.
The third category is environment, six contextual variables that capture variation invisible to box scores, namely travel distance and direction weighted by recency and cumulative load, altitude, venue hostility, days of rest, rivalry intensity, and tournament stage.
The build
The modeling pipeline starts from a validated baseline and adds complexity only where it earns its place. Random forests set the performance baseline, and every later model had to show statistically verifiable improvement in both accuracy and profitability against historical lines. Ensemble stacking then combines gradient boosting, which handles the heterogeneous feature space, with neural components that capture nonlinear interactions between contextual features and performance metrics. A Mixture of Experts deploys specialists per target, spread, over/under, and moneyline, with a gating network that weights them by matchup, leaning on the contextual specialist for a high-travel, high-rivalry game and the synergy specialist for a matchup between stylistic opposites. Parallelized hyperparameter tuning across distributed compute optimizes for profitability rather than marginal accuracy, and automated model selection gates every deployment on dual thresholds, so a model must show positive expected value against actual lines across a meaningful sample, on both accuracy and profitability, before it ships.
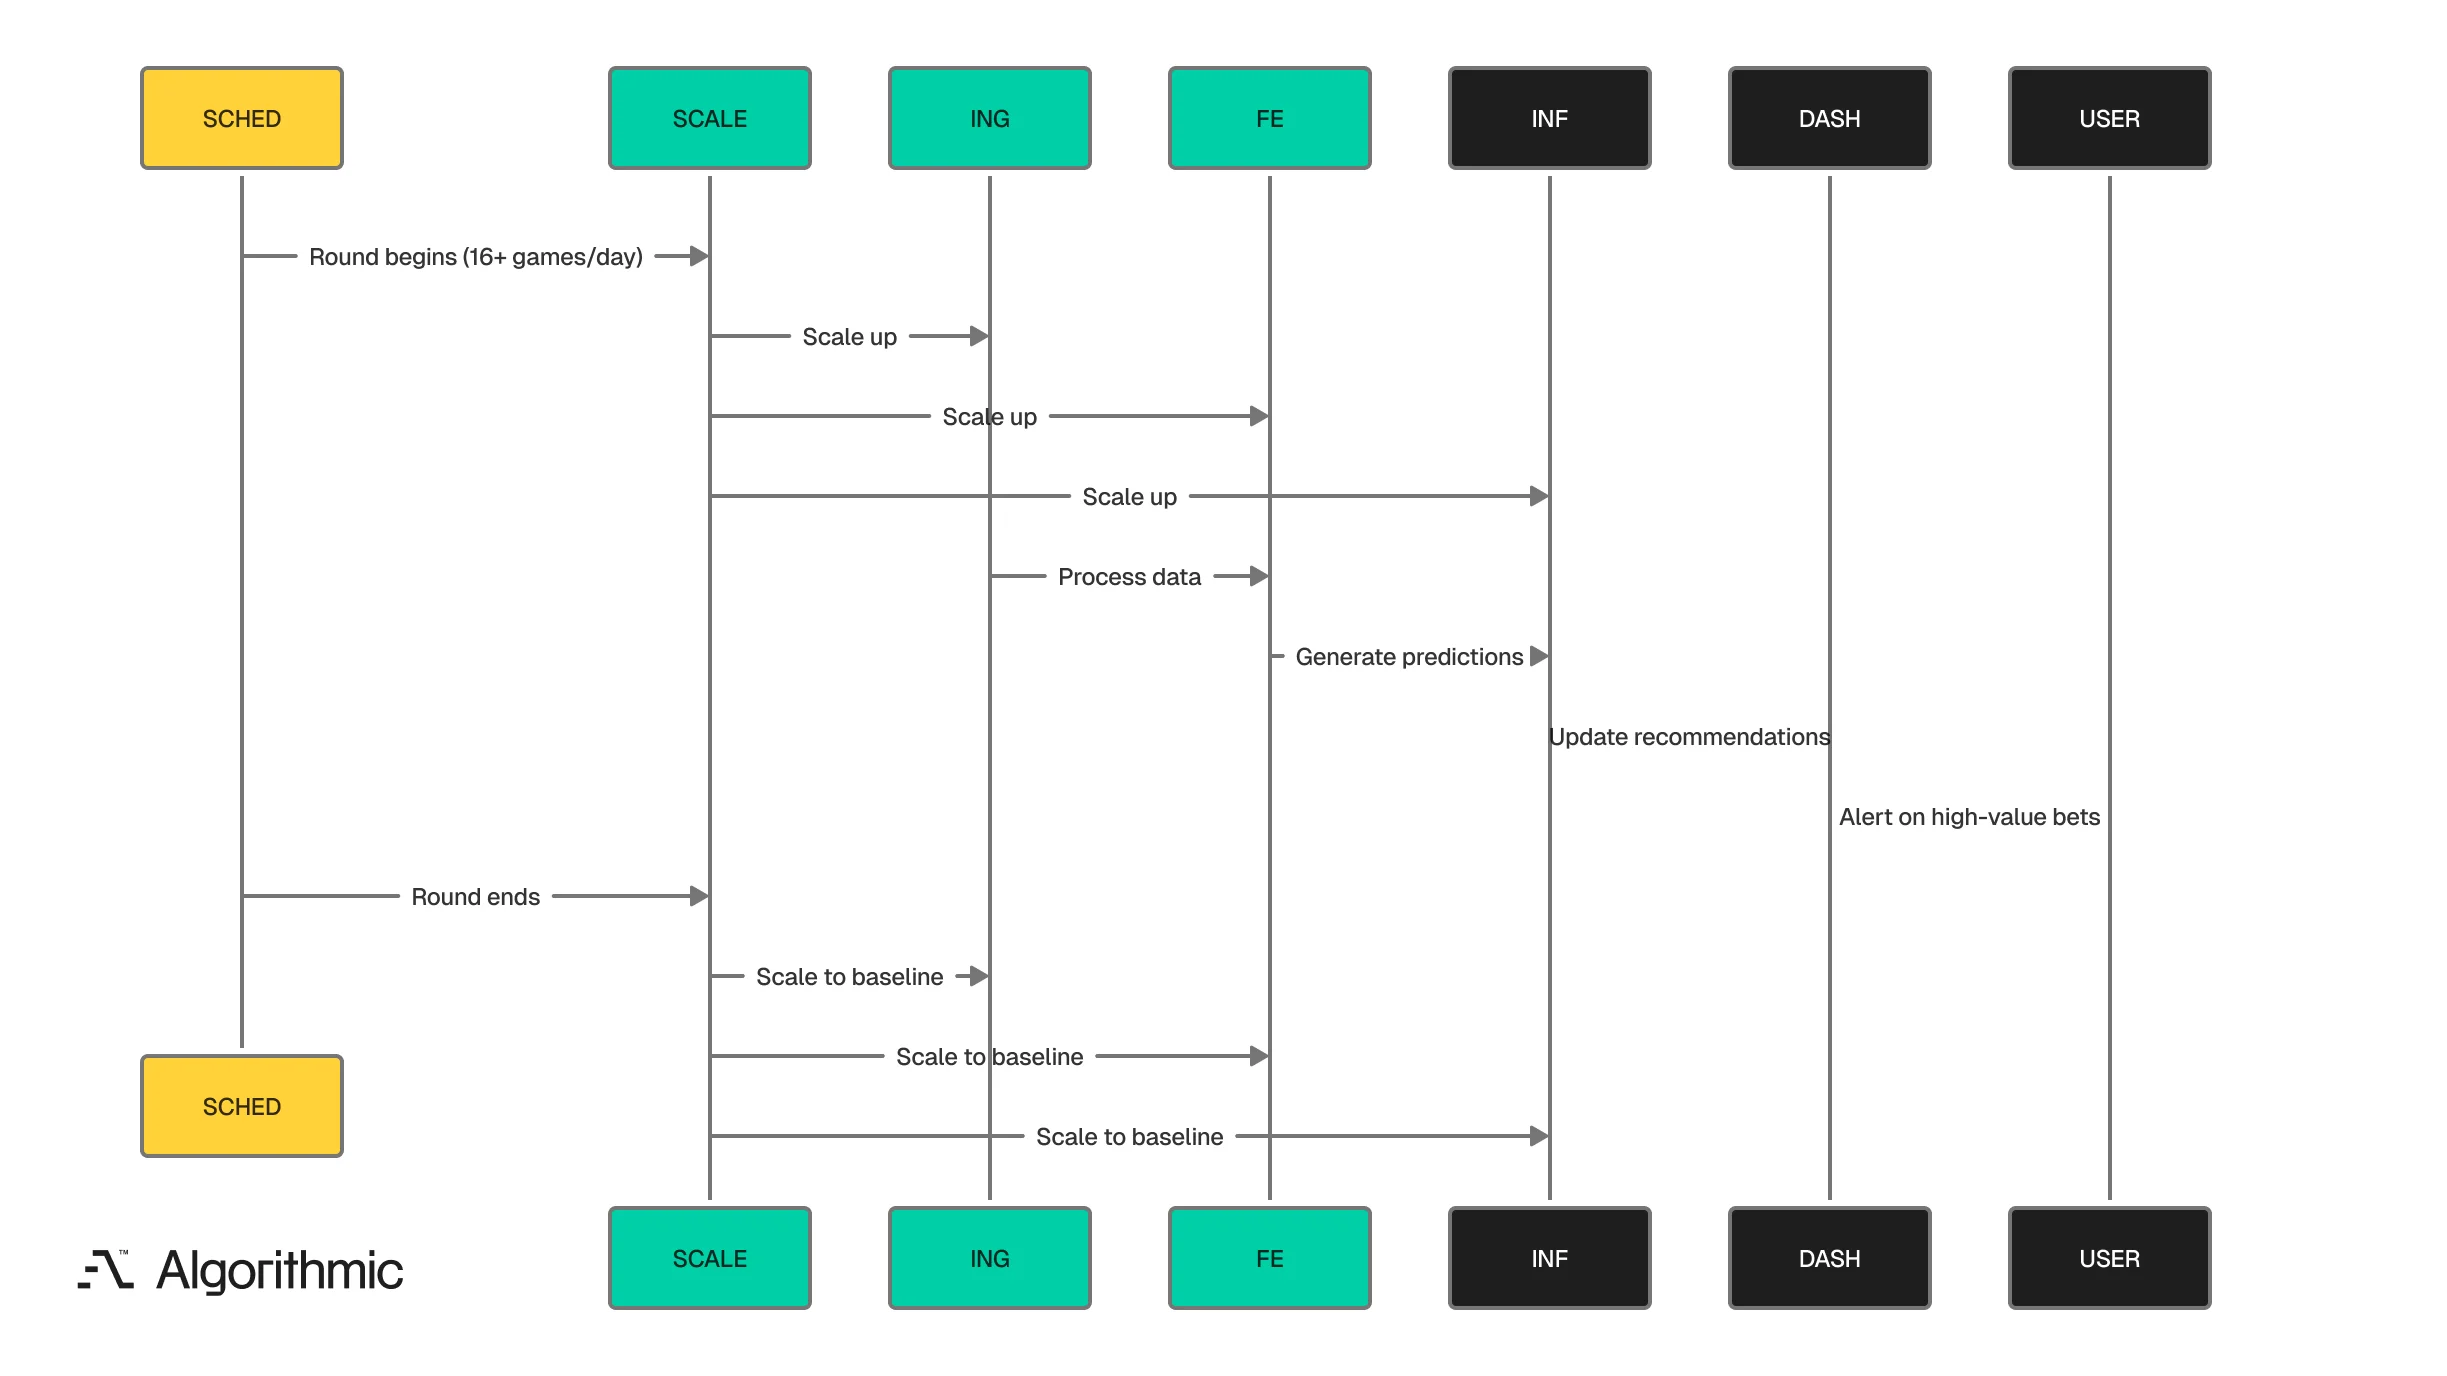
Each stage, ingestion, feature engineering, training, inference, and dashboard serving, runs as an independent containerized service that can update, scale, and roll back without affecting the others. The live dashboard gives professional bettors a profit-over-time view segmented by bet type, conference, and team, a bet-distribution view across spread, moneyline, and over/under, and team-level drill-downs with per-team profitability and confidence that flag consistently unprofitable teams for exclusion. Automated alerts fire when profit drops below calibrated thresholds and can reduce exposure to underperforming segments. March Madness concentrates 67 games into three weeks, so the cloud-native architecture scales compute automatically for tournament rounds and returns to baseline when each round concludes.
 Click to expand
 Outcomes
| Metric | Result |
|---|---|
| ROI | Double-digit returns in backtested and live environments |
| Feature discipline | Ablation-tested, only features improving both accuracy and profitability retained |
| Model selection | Automated, dual accuracy/profitability thresholds gating all production deployments |
| Architecture | Modular, each pipeline stage independently deployable and rollback-capable |
| Tournament handling | Cloud-native auto-scaling for March Madness demand spikes |
| Adaptability | Pipeline portable to NBA, MMA, soccer, and non-sports domains |
College basketball prediction sits at the intersection of sparse history, extreme team heterogeneity, and context that resists quantification. The system handles all three, ingesting multi-source data continuously, engineering features that capture context standard models ignore, and deploying predictions gated on the only metric that matters, profitability. Because the design is modular, the architecture adapts to other domains by swapping data sources and feature engineering while keeping the ingestion, training, deployment, and monitoring infrastructure, and we have applied the same approach to NBA, MMA, and non-sports problems.
This platform was delivered through Algorithmic’s predictive analytics and data infrastructure practices.