

A model that succeeds on 90% of production runs can still lose money, because the remaining 10% can trigger legal review, customer remediation, engineering rollback work, or manual operations queues. That gap is an accounting failure in many production ML systems, where teams report aggregate pass rates, latency, and token spend, so finance sees a positive dashboard while operations absorbs silent errors, review hours, senior escalations, and customer-facing corrections.
Production machine learning engineering needs a stricter monitoring standard. The unit of measurement should be the priced failure, and successful inference volume should sit behind the cost of the failures that remain. A production model earns its place when it reduces total cost at the required risk level, so a high pass rate supports that case only when the remaining failures have a known price, because without priced failures leadership approves expansion with incomplete economics.
Aggregate success rates hide cost concentration in failures
A 90% success rate sounds strong in a product review. It says little about unit economics, cash exposure, or operational risk. A model can pass most runs and still move expensive work into queues that never appear in the ML dashboard.
 Click to expand
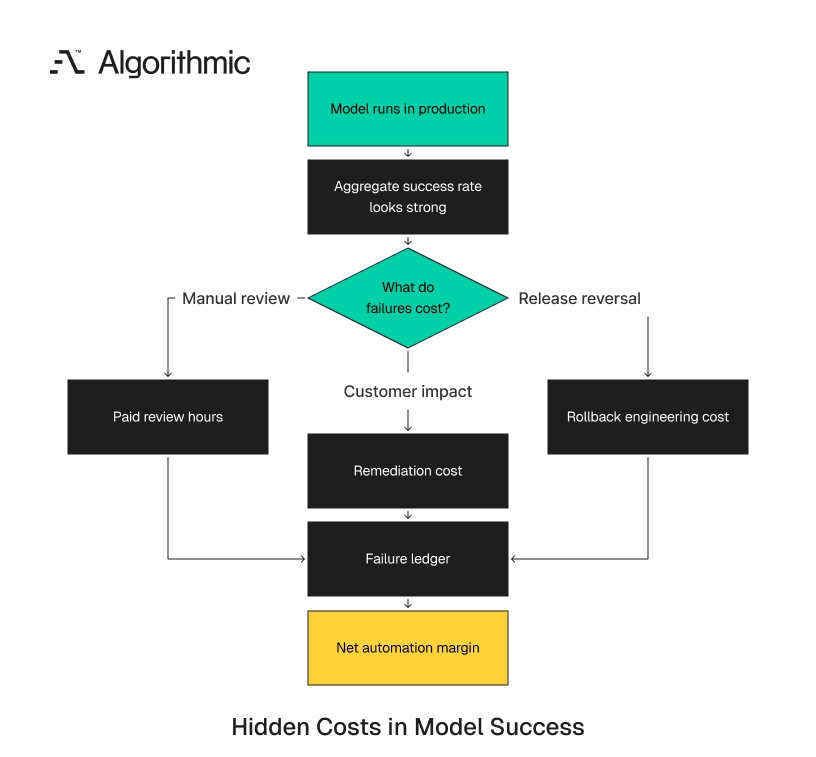
 Consider an AI workflow that processes 10,000 insurance claims per month. The model completes 9,000 claims without escalation, while the remaining 1,000 require manual review because of missing evidence, hallucinated policy references, or incorrect claim categorization. If each failed automation run consumes 18 minutes of human review at $85 per hour, monthly review cost reaches $25,500, and if 4% of those failures reach customers and require remediation at $140 per case, monthly cost rises by $5,600, and if two releases require rollback work from three engineers for half a day, engineering cost adds $4,800 at $200 per hour.
The model still reports 90% success. The failure ledger shows $35,900 per month in avoidable operating cost before reputational damage, SLA credits, or management review time, and that ledger changes the release discussion because it converts defects into paid work. This cost pattern appears in claims, support, finance operations, underwriting, logistics, and internal developer tools, where a small failure segment often consumes most of the human labor, so the model dashboard shows stable technical metrics while the operating model loses margin through exception handling.
Model monitoring needs to price the failures that remain. Business value depends on net reduction in labor, risk, and cycle time, so a model-level pass rate is a technical statistic while a priced failure rate is an operating metric. The distinction matters most when automation moves from pilot to production, because a pilot with 500 internal runs can absorb defects through informal review, while a production workflow with 50,000 monthly runs turns the same defect rate into headcount, escalation load, and customer exposure.
Production monitoring must measure what the business pays for
The standard ML dashboard tracks model metrics such as accuracy, precision, recall, F1 score, latency, throughput, token cost, and drift. These metrics matter for MLOps engineering, but they do not tell a CFO whether automation reduced cost. Production dashboards for automation need four additional measurement layers, where each layer connects model behavior to a paid operational consequence, and these layers belong beside technical telemetry, not in a separate monthly spreadsheet.
Silent error rate
Silent errors are failures that pass through the system without immediate detection. They carry high risk because they create downstream cost outside the model boundary, so a silent error often reaches the customer, the ledger, or the regulator before the model team sees it. Examples include an LLM submitting incorrect code to a repository, a claims model approving a case with incomplete evidence, and a recommendation engine suppressing high-margin products for a customer segment, where the system returns a valid response while the business process receives an invalid result.
Silent error rate should be measured through sampling, human audit, customer complaint matching, and downstream reconciliation. In high-risk workflows a 1% silent error rate can invalidate a 95% task completion rate, because the completion rate shows workflow throughput while the silent error rate shows hidden liability. The sampling design needs discipline, so a weekly audit of 300 cases gives a first read for high-volume workflows, while regulated workflows often need stratified sampling by customer segment, transaction size, and decision type.
Sampling should include successful-looking cases, not only exceptions. If the audit reviews only escalations, it measures visible failure and misses silent correctness errors. The sample must include auto-approved, auto-rejected, user-corrected, and reviewer-corrected outcomes.
Rollback frequency
Rollback frequency measures how often model outputs, prompts, agents, or releases must be reversed. This metric matters because rollback work consumes senior engineering time and delays planned product work, and it also exposes release process weakness before the weakness becomes a customer incident. For ML model deployment services, rollback rarely means one command, because it includes reverting prompts, restoring model versions, replaying events, invalidating cached decisions, reconciling database records, and notifying support teams, and in agentic workflows it can also include reversing tool actions that touched CRM, ticketing, billing, or source control systems.
A model that requires rollback every two weeks has a different cost profile from one that runs for 90 days without intervention. The first model creates release drag, incident load, and management overhead, while the second creates operational confidence. Rollback frequency should be tied to release gates, so if one workflow needs more than one rollback per month, the release process needs stronger evaluation, narrower scope, or more audit coverage, and the rollback record should name the affected version, root failure class, customer exposure, and paid teams involved.
A rollback metric has more value when paired with rollback duration. A 20-minute prompt revert and a 3-day data correction effort carry different economics. The dashboard should record both count and paid recovery hours.
Human review hours
Human review often hides inside “exception handling”, a label that masks the main cost of partial automation, because a workflow that removes one task and creates another has not reduced operating cost. A support automation workflow that reduces ticket handling time from 12 minutes to 5 minutes appears attractive, yet if 15% of tickets require escalation to senior agents for 25 minutes each, the blended cost per ticket changes materially, so the correct unit is paid review time per resolved task.
Human review should be tracked by queue, reason code, reviewer seniority, and rework outcome. The primary metric is paid review time per completed automation run, which captures both visible exceptions and quality failures that require correction. Reviewer seniority matters because escalation costs differ, so a Tier 1 support agent at $45 per hour and a compliance reviewer at $140 per hour create different economics, and the dashboard must reflect that difference.
Review queues also need aging metrics. A 12-minute review completed within one hour has a different customer effect than the same review after three days. Queue delay belongs in the cost model when it affects SLA credits, churn, or delayed revenue recognition.
Dollars lost per failed run
Every failure class should carry a dollar value. This turns model monitoring into a management system, and it also forces teams to separate inexpensive defects from release-blocking defects. A failed personalization run can cost $0.40 in lost margin, a failed contract review can cost $600 in lawyer review time, and a failed payment-risk decision can cost $3,000 in chargebacks, remediation, and support time.
The range matters, because a single average failure cost hides the risk distribution and understates rare, expensive events, so leaders need the median, 95th percentile, and tail exposure before they approve scale-up. Finance should assign costs with operations and engineering, and the first version does not need perfect accounting, only consistent cost bands, visible assumptions, and monthly reconciliation against spend.
Cost bands should map to operational reality. For example, a support correction may sit in a $5 to $25 band, while a compliance escalation may sit in a $400 to $1,200 band. The point is decision accuracy, not accounting precision to the cent.
A failure-priced monitoring scorecard
The following scorecard gives CFOs, CTOs, and product leaders a shared view of automation economics. It can be built in Datadog, Grafana, Looker, Metabase, or a warehouse-backed executive dashboard. The tool matters less than the discipline of assigning owners, thresholds, and dollar values.
| Metric | Definition | Required instrumentation | Owner | Decision threshold |
|---|---|---|---|---|
| Auto-apply precision | Correct auto-applied outputs divided by all auto-applied outputs | Human audit sample, outcome labels, production event IDs | Product and ML lead | Below 98% blocks expansion in regulated workflows |
| Silent error rate | Undetected incorrect outputs found after downstream review | Audit queue, complaint matching, reconciliation jobs | Risk or operations | Above 0.5% triggers scope reduction |
| Median time to detect | Median time between incorrect output and detection | Event timestamp, detection timestamp, incident tag | Engineering | Above 24 hours requires alert redesign |
| Rollback frequency | Number of model, prompt, or agent rollbacks per month | CI/CD records, model registry, deployment events | Engineering | More than 1 per month requires release gate review |
| Human review minutes per run | Total paid review minutes divided by automation runs | Review queue timestamps, staff cost bands | Operations | Above target labor saving invalidates ROI |
| Cost per failed run | Fully loaded cost of each failure class | Finance cost model, incident records, remediation logs | Finance | Any class above margin per transaction blocks scale-up |
| Net automation margin | Gross labor saving minus inference, review, rollback, and remediation cost | Warehouse model joining product, finance, and observability data | CFO and CTO | Negative margin blocks customer rollout |
This artifact forces one discipline, where every failure mode receives an owner, an economic value, and a threshold. It removes ambiguity from release reviews, and it prevents teams from averaging high-risk failures into harmless-looking totals. The scorecard changes meeting behavior, so product leaders cannot defend expansion with task completion alone, and engineering cannot treat rollback as a private operational burden.
Finance can see whether automation improves margin after exception handling, operations can show whether the new workflow reduced queues or renamed them, and risk teams can tie policy thresholds to observed error patterns. A useful scorecard has named owners, because “Operations” as a broad label is insufficient for release control, so the dashboard should name the queue owner, engineering lead, finance partner, and executive sponsor.
Named ownership matters during incidents. If silent errors exceed the threshold on a Friday afternoon, the team needs a named decision-maker for scope reduction. A generic function name creates delay at the exact moment the workflow needs control.
The economics change when tasks become long-running
Short benchmark tasks understate production risk. Long-running agentic workflows compound failure probability across steps, so a workflow with strong local performance can still fail often at the end-to-end task level. A 2026 paper, Beyond pass@1: A Reliability Science Framework for Long-Horizon LLM Agents, makes this distinction explicit, arguing that benchmarks often measure whether a model succeeds on a single attempt, while production deployments require reliability across repeated invocations and tasks of varying duration.
This changes automation economics, because a workflow with ten dependent steps can fail despite a strong per-step success rate, and each step adds another place where review, retry, rollback, or correction can enter the cost model. If each step succeeds 97% of the time and failures are independent, ten steps succeed end-to-end about 74% of the time, and at 20 steps the end-to-end success rate falls to about 54%, so a dashboard can show strong local performance while the workflow creates frequent human intervention.
Long-horizon workflows also create partial-completion cost. An AI coding agent can generate a correct patch, fail tests, change unrelated files, open a pull request, and require a staff engineer to reverse the work, so the failure cost includes review time, CI minutes, blocked deployment, and opportunity cost. Production monitoring should track end-to-end task completion, step count, retries, and human intervention, and for AI agents task duration and tool-call sequence belong in the cost model, because a failed step at minute 2 has a different cost from a failed step after 47 tool calls and three database writes.
This is especially important for agentic workflows that write to production systems. A read-only summarization tool has bounded exposure, while an agent that edits CRM records, updates tickets, issues refunds, or changes code creates direct operating risk. The cost model should separate read, recommend, draft, approve, and execute stages, because each stage has a different failure cost and control requirement, so a draft-stage error can cost review minutes while an execute-stage error can trigger customer remediation.
Stage separation also improves release design. Teams can expand read and draft stages before granting execute permissions. That staged approach gives leaders measured exposure instead of a single binary launch decision.
Monitoring budget should be tied to incident cost
Monitoring spend is an insurance decision with engineering content. Under-monitoring saves dashboard cost and increases incident exposure, so the correct budget follows the cost of failures, the value of transactions, and the degree of customer exposure. SFAI Labs argues that 8% to 14% of total AI project spend is a defensible allocation for production monitoring, and the right allocation depends on domain risk, automation scope, customer exposure, and remediation cost, so a fixed percentage provides a starting point while failure scenarios set the final number.
A customer support summarization feature has one risk profile, an automated medical intake system has another, and a code-generation agent with repository write access carries engineering rollback risk and security exposure. Monitoring budgets should be sized against expected incident cost and transaction exposure, so a $250,000 ML system that touches $40 million in annual transaction value deserves a stronger control layer than a $250,000 internal search tool, because the larger exposure justifies more audit storage, testing, alerting, and incident response work.
This is where many AI product development studio engagements fail during scale-up. The prototype budget includes model integration and a demo interface, while the production budget needs observability, audit logging, evaluation sets, drift detection, incident response runbooks, and finance-grade cost attribution. Budget discussions should use failure scenarios, so one severe policy incident, one rollback week, and one month of exception handling give leaders a practical range, which sets the monitoring budget better than a fixed percentage alone.
A common control package includes event logging, trace storage, alert routing, evaluation jobs, audit queues, and monthly finance reconciliation, and for regulated workflows it adds approval logs, retention controls, and policy exception reports, all funded before the workflow receives broader production traffic. The budget discussion should also include storage and retention, because high-risk workflows need enough trace history to reconstruct decisions months later, and short retention periods save storage cost while creating larger legal and operational exposure.
Success-rate dashboards need failure taxonomies
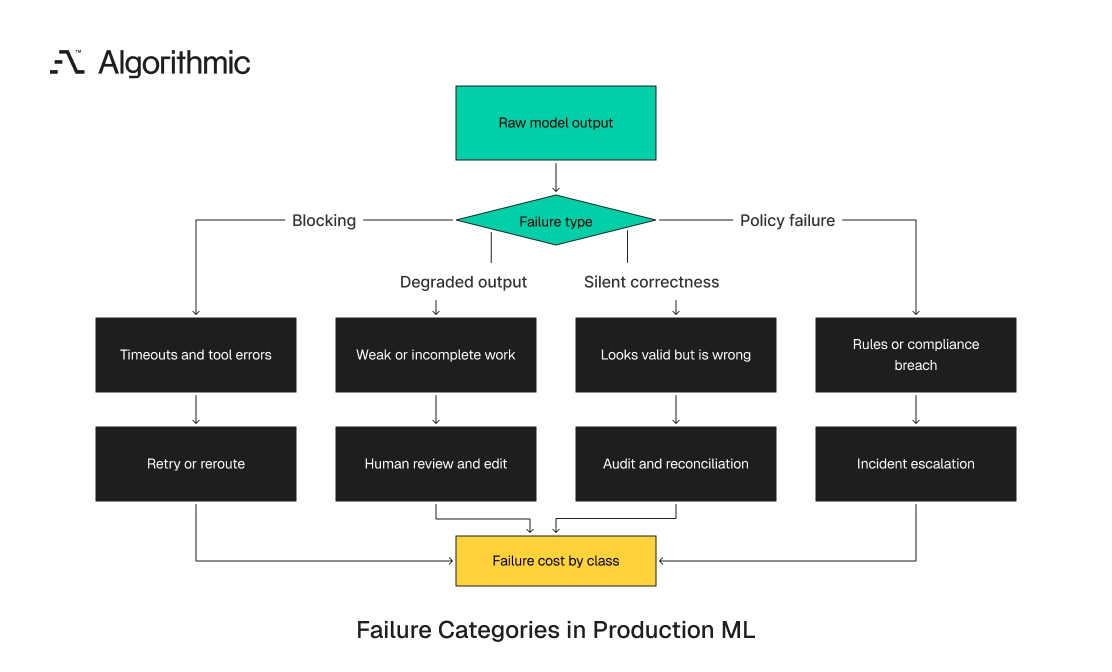
A single “failed” label is too broad for production decision-making. Different failure modes create different costs and require different controls, so a taxonomy turns a defect count into an operating plan. A useful taxonomy separates failures by operational consequence, and the categories below cover the main failure patterns in production automation, kept small enough for reviewers to use consistently.
 Click to expand
 Blocking failures
Blocking failures stop the workflow. They are visible and usually easier to route, yet they still consume time, retries, and operational attention. Examples include timeout errors, JSON parsing failures, missing required fields, and failed tool calls, so the cost is delay, retry expense, and queue management, and these failures are measurable with standard observability and monitoring tools.
Blocking failures are operationally manageable when the fallback path is defined. The runbook should specify retry limits, queue routing, customer messaging, and owner escalation, because without that runbook a visible failure becomes an unmanaged queue. Engineering teams should track these failures by dependency, so model provider timeouts, vector database latency, rate limits, and tool authentication failures need separate counters, because one aggregate blocking-failure rate hides which service needs repair.
The threshold should reflect the user promise. A daily internal analytics workflow can tolerate a different blocking rate than a checkout fraud workflow. The dashboard should tie the threshold to the SLA or operating commitment.
Degraded-output failures
Degraded-output failures produce lower-quality work that passes basic validation and creates rework, and they are common in summarization, support drafting, classification, and code-generation workflows. Examples include incomplete summaries, weak recommendations, inaccurate classifications, and code changes that pass syntax checks while missing product intent, and they often increase human review time because reviewers must inspect the full output, so a short defective summary can take longer to correct than to write from the source material.
These failures need human evaluation data, task-specific scoring, and reviewer reason codes. A binary pass-fail label gives too little information for model improvement, because the team needs to know whether the problem is missing evidence, wrong category, unsupported reasoning, or policy deviation. Reviewer forms should include a small fixed taxonomy, such as incomplete, incorrect, unsupported, policy violation, wrong tone, wrong category, and missing evidence, where free-text comments help investigation and fixed codes support trend analysis. Reviewers should also record whether they corrected, rejected, or escalated the output, because that outcome determines cost, so a 2-minute edit and a 30-minute escalation should never share the same failure price.
Silent correctness failures
Silent correctness failures are valid-looking outputs that are wrong in a business-specific way. They carry the highest cost because they bypass ordinary checks, and they often surface through disputes, audits, customer complaints, or delayed financial reconciliation. A contract analysis system can omit a change-of-control clause, a billing support agent can quote the wrong refund policy, and a fraud model can approve a transaction that later becomes a chargeback.
Availability and correctness are separate measures, because traditional uptime does not capture whether a probabilistic system made the right decision, so production leaders need both views. Silent correctness failures require audit sampling, downstream reconciliation, and customer-impact tracking, along with delayed labeling, because the business outcome often appears days or weeks after the model decision, so the monitoring system must connect the model event to later business events.
For lending, insurance, chargebacks, and healthcare intake, delayed labels are central to monitoring. The system should join model decisions to later outcomes, including disputes, reversals, complaints, and manual overrides, and this join requires stable identifiers across product, finance, and support systems.
Silent-error detection also needs negative sampling. Teams should review a subset of cases with no complaint and no escalation. Otherwise, the monitoring process learns only from failures that customers or employees already found.
Policy and compliance failures
Policy failures violate internal rules, legal constraints, or customer commitments, and their cost is nonlinear, because one privacy breach, discriminatory output, or unauthorized automated decision can exceed the labor savings from thousands of successful runs. These failures need severity-weighted scoring and escalation rules, so a low-severity style deviation belongs in a product backlog, while a high-severity compliance breach belongs in incident management with named legal, risk, and executive owners.
AutoMonitor-Bench, a 2026 benchmark for LLM-based misbehavior monitors, uses 3,010 annotated samples across question answering, code generation, and reasoning, and it evaluates monitors using Miss Rate and False Alarm Rate across 12 proprietary and 10 open-source LLMs. The useful lesson for production teams is direct, since the monitor itself needs evaluation because weak detection creates false confidence, so monitor evaluation should be part of the release process, because a detector with a low false alarm rate and high miss rate gives teams a clean dashboard while failures pass through, and a detector with a high false alarm rate burns review capacity and trains users to ignore alerts.
Policy monitoring also needs traceability. Teams should retain the prompt, model version, retrieved documents, tool calls, and final output for each high-risk decision, because without this trail incident review becomes reconstruction work. Traceability should include the policy rule applied at decision time, because policies change and a decision that was compliant in March may be questioned in September, so versioned policy references reduce dispute time during audits.
The finance model should sit next to the model monitor
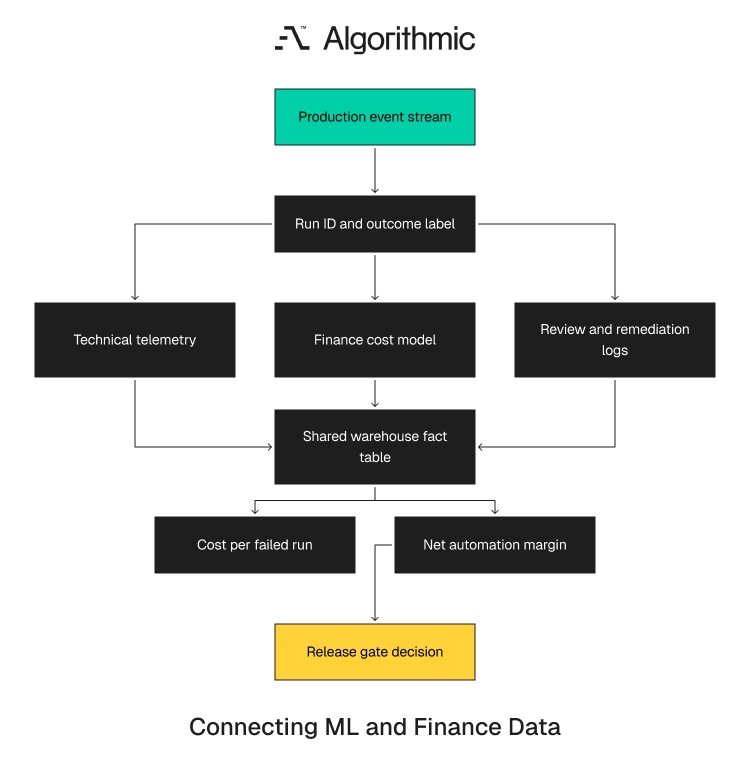
The most useful ML monitoring systems join technical telemetry with finance data. This requires a small number of shared identifiers. Without those identifiers, engineering sees events and finance sees cost, with no reliable connection between them.
 Click to expand
 Each automation run should have a run ID, customer ID or account segment, workflow type, model version, prompt version, tool-call trace, outcome label, review status, and cost allocation. These fields allow engineering, product, operations, and finance to inspect the same event, and the shared event record becomes the source for both incident review and margin analysis. A data warehouse architecture for this is straightforward, so product events land in Snowflake, BigQuery, Redshift, or Databricks, and dbt transformations map raw events to workflow facts.
Observability data from OpenTelemetry, Datadog, or Prometheus joins to model registry data from MLflow, Weights & Biases, or SageMaker Model Registry, finance tables add labor rates, remediation costs, gross margin, and contractual penalty exposure, and the result is a run-level fact table with both technical and economic fields. The executive dashboard should show net automation margin by workflow and the distribution of failed-run cost, because a single margin number does not show tail risk.
Average cost can hide exposure. A workflow with a mean failed-run cost of $12 and a 99th percentile failed-run cost of $2,400 needs executive attention, because tail cost determines whether a workflow can receive broader traffic, especially in regulated or high-value transactions. Cost-only AI dashboards fall short in this environment, because token spend is one input, and the model provider invoice captures only part of production inference economics.
Review labor, orchestration, retries, vector database queries, logging, and remediation determine the full cost per resolved task, so the finance model should calculate resolved-task cost, not isolated model-call cost, because the resolved-task view aligns the dashboard with how the business earns revenue and pays labor. The same warehouse model should support release reviews, so before expansion leaders should see net automation margin, error distribution, incident history, and rollback count, and that evidence belongs in the same decision process as product adoption and customer satisfaction.
This model also improves vendor evaluation. A cheaper model with higher review cost can be more expensive per resolved task than a higher-priced model with fewer escalations. Procurement should compare resolved-task economics, not only unit inference prices.
A practical 30-day build plan
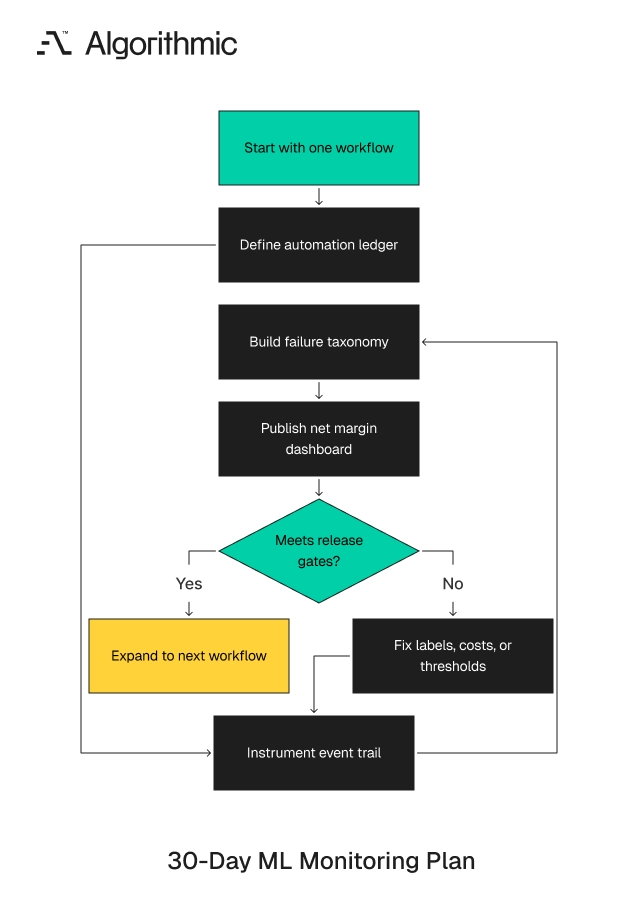
Failure-priced monitoring does not require a six-month data platform program. It requires disciplined instrumentation and agreement on cost ownership. A focused team can build the first version in 30 days if the scope stays narrow.
 Click to expand
 The work can start with one production workflow. A narrow scope creates faster learning and reduces cross-team negotiation, and once the first workflow works, the same pattern extends to adjacent workflows. The first workflow should have meaningful volume, clear outcomes, and measurable labor cost, so a low-volume executive demo is the wrong candidate, while a monthly queue with hundreds or thousands of runs gives the team enough data to price failures.
Days 1 to 5 define the automation ledger
Select one production workflow and document every outcome state, covering auto-completed, user-corrected, human-reviewed, rolled back, customer-remediated, abandoned, and escalated, where each state maps to a business process that already exists. Assign a dollar value to each state using fully loaded labor rates, customer support cost, legal review cost, gross margin effect, cloud spend, and contractual exposure, and if a cost varies by severity, create a small set of bands.
Finance should own the cost assumptions. Operations should verify review time and remediation effort, and engineering should verify inference, logging, retry, and rollback cost. The first ledger should fit on one page, so if the team needs 40 outcome states the workflow definition is too broad, and the team should start with the states that change release decisions.
The ledger should also record assumptions. For example, a senior reviewer rate, average remediation time, and support contact cost should be visible. Visible assumptions make the first reconciliation faster at month end.
Days 6 to 12 instrument the event trail
Add run IDs across the workflow, and capture model version, prompt version, input class, tool calls, latency, retries, reviewer ID, review duration, and final outcome, because these fields create the minimum viable event trail for failure pricing. Store these events in the warehouse and avoid sampling during this stage, because the first month needs full traceability.
Add timestamps for each stage, capturing created time, model start time, model completion time, review start time, review completion time, customer contact time, and final resolution time, because these fields expose queue delay and labor cost. The event trail should survive system boundaries, so if the workflow moves from product UI to queue tool to CRM, the run ID must move with it, because without a persistent identifier cost attribution breaks.
Engineering should test the event trail with five real cases. Trace each case from model call to outcome and finance allocation. Any missing join should be fixed before the dashboard build starts.
Days 13 to 20 build the failure taxonomy
Classify failures into blocking, degraded-output, silent correctness, and policy categories, add reason codes for each class, and keep the first taxonomy small enough for reviewers to apply during normal work. Create a weekly audit sample, so for high-volume workflows start with 300 reviewed cases per week, while for high-risk workflows review every exception until the error distribution is stable.
Train reviewers on the taxonomy. Two reviewers should label a small shared set and compare results, and if they disagree on more than 10% of cases, the labels need clearer definitions. Add examples to each reason code, so a good label guide shows one correct case, one degraded case, one silent error, and one policy failure, because review quality improves when examples are concrete.
The taxonomy should feed model improvement work. If “missing evidence” becomes the largest category, the team should examine retrieval, prompt constraints, and source document coverage. If “wrong category” dominates, the team should inspect training labels and decision definitions.
Days 21 to 30 publish the net margin dashboard
Report five numbers to the executive team, which are auto-apply precision, silent error rate, human review minutes per run, rollback frequency, and net automation margin. These five metrics give leaders a direct view of quality, risk, labor, release stability, and economics, so add technical counters only when they explain one of these outcomes. Keep the first dashboard narrow, because a focused dashboard with five priced metrics will drive better decisions than a broad dashboard with 40 technical counters, and the first version should answer whether the workflow earns expansion.
Add one distribution view for failed-run cost. Leaders need to see the median, 95th percentile, and 99th percentile, because tail cost often decides whether a workflow can expand. Set release gates in writing, so expansion stops if silent error rate exceeds 0.5%, rollback frequency exceeds one per month, or net automation margin turns negative, because written gates reduce negotiation during launch pressure.
The dashboard should show the last 7, 30, and 90 days once enough history exists. Short windows detect release regressions. Longer windows show whether the workflow has stable economics.
Common failure modes during rollout
Several patterns break failure-priced monitoring during the first 90 days. They are predictable and preventable. Most come from missing identifiers, unclear ownership, or late finance involvement.
The first pattern is missing outcome labels, where teams capture prompts, completions, and latency, then fail to record whether the task resolved, so without the outcome label the dashboard measures activity instead of business result. The second pattern is disconnected review queues, where human reviewers use Zendesk, Salesforce, ServiceNow, Jira, or a spreadsheet without passing the run ID, so the model event and the human review event become separate records.
A third pattern is cost averaging across dissimilar work, because a $4 support correction and a $900 compliance review cannot share one failure cost, so cost bands should reflect the operating process that pays for correction. The fourth pattern is delayed finance involvement, where engineering creates a monitoring dashboard and finance then rejects the assumptions during budget review, so finance should join during the first week, when the ledger is defined.
The fifth pattern is treating rollback as an engineering-only metric, when rollback consumes support, operations, customer success, and management time, so the rollback ledger should include every paid team involved in correction. The sixth pattern is sampling only failures that are already visible, which misses silent correctness errors that often carry the highest cost, so audit samples should include auto-approved and auto-completed cases.
A seventh pattern is measuring model calls instead of resolved tasks, because a single task can include multiple calls, retries, tool actions, and human review, so the finance model should price the resolved task since that is the unit the business pays for. The eighth pattern is allowing thresholds to remain informal, so teams then renegotiate the standard during launch pressure, while written gates protect the operating model when adoption numbers look attractive.
The operating standard for production ML
Model monitoring should answer one management question. Did automation reduce total cost at the required risk level? That answer requires priced failures, and it also requires a shared event record that connects model behavior to labor, remediation, rollback, and margin. Production metrics must replace demo metrics before scale-up, so end-to-end workflow measurement must sit beside isolated model pass rates, and net automation margin should be the release gate when automation touches customer, financial, legal, or operational decisions.
Across 35 complex software engagements, including platforms serving more than 14 million end users, we have seen the same pattern in production-ready software development and ML systems. Teams that instrument cost, quality, and rollback behavior before scale-up make better release decisions, while teams that rely on aggregate success rates discover the economics through incidents. CFOs, CTOs, and product leaders should require a failure-priced monitoring scorecard before expanding any AI automation workflow, so start with one workflow, instrument every run for 30 days, assign dollar values to each failure class, and use net automation margin as the release gate, because that standard turns model monitoring from technical reporting into production management.
Algorithmic builds production machine learning systems where every failure type is priced and monitored, not just the headline success rate. Ask us to audit your model’s failure ledger before you scale automation.