
A reporting dashboard that refreshes every four hours has no business case for Kafka, Flink, and a schema registry running every hour of the year. A fraud model that waits for a nightly batch run gives attackers a full operating day before intervention. Most teams make this infrastructure decision without the metric that should govern it, which is freshness. Freshness is the elapsed time between a business event and the moment derived data becomes available to the decision that depends on it.
Streaming versus batch processing is a data infrastructure choice that should follow freshness service level objectives. A freshness SLO defines p50, p95, and p99 targets for data movement from event ingestion to a queryable table, materialized feature, alert, dashboard, or operational API. Google’s SRE practice already frames service level objectives this way, since tail percentiles, not averages, describe what users actually experience. Without those targets, teams select tools based on fashion, vendor pressure, or an assumed cloud cost, and that assumption fails in production where staffing, incidents, backfills, and audit work drive the bill.
A processing decision needs one written artifact, the freshness requirement for each consumer. That artifact should name the business decision, tolerated delay, correctness rule, owner, and processing mode. It should also state the cost of stale data in business terms, such as declined transactions, delayed support queues, inaccurate revenue reports, missed abuse signals, and customer communications sent from outdated records. The artifact should fit on one page for most systems. If the team cannot state the decision, delay tolerance, and stale-data cost in writing, the architecture decision is premature.
Freshness must be defined at the decision level
A pipeline rarely has one freshness requirement. Each downstream decision has its own tolerance for delay, and that tolerance comes from the business process. Fraud scoring needs sub-second or single-digit-second freshness when the decision occurs during checkout, account login, payout approval, or card authorization. Stripe runs its machine learning fraud model inside the authorization path under a sub-100ms budget, and a five-minute delay in that context changes the outcome because the transaction has already cleared.
Personalization needs freshness between seconds and minutes, based on the feature, since current-session ranking needs faster updates than a next-session recommendation email. A user who views hiking boots, then navigates to backpacks, expects the current session to reflect the new intent. A recommendation produced two hours later belongs in an email campaign, not the active shopping session.
Support triage can accept 5 to 15 minutes for most routing decisions, and an agent queue ranked every ten minutes still gives supervisors a useful operating view. The business risk comes from unresolved high-severity tickets and missed escalation thresholds, so second-by-second score changes rarely change staffing decisions in a support queue.
Finance reporting requires correctness over speed, with freshness measured in hours or days after accounting cutoffs. A revenue report published before payment settlement, refund adjustments, and contract rules creates reconciliation work that costs more than the latency saved by early publication. It also creates a second cost, since finance teams spend the next close cycle explaining why the number changed.
Executive dashboards need stable daily or intra-day figures and clear definitions for event-date, report-date, and late-arriving data. A board metric that changes after distribution damages trust faster than a metric delivered one hour later. Once executives build plans on a number, revisions become governance events.
The failure pattern is consistent across data platforms. Teams define “real time” as a technical label before they define the business decision, and that sequence creates avoidable infrastructure cost in one direction and stale analytics in the other. The architecture inherits the ambiguity in the requirement.
A customer record shows the problem clearly. The same customer table can feed a daily net revenue dashboard, a same-session personalization model, a support health score, and a fraud graph. One table serves four decisions with four freshness requirements, so treating that table as a single data product hides the actual operating need.
The decision-level view also changes ownership, since finance owns the revenue cutoff, risk owns the fraud decision window, support owns queue triage, and product owns personalization latency. A single freshness target across those owners produces conflict, because each owner needs a target tied to the decision they accept and the risk they carry. This distinction matters during funding reviews. A chief financial officer will approve daily batch reporting for revenue close and reject a seven-figure streaming program for the same dashboard, while a chief risk officer will fund sub-second decisioning when fraud losses justify the operating model. The same company can need both patterns in different parts of the data platform, and decision-level freshness moves the conversation from preferred tools to the time window that protects revenue, risk, and customer experience.
p50, p95, and p99 freshness targets prevent vague choices
Average latency is a poor design target for data freshness. A pipeline with 2-minute average freshness and 90-minute p99 freshness will miss operational decisions during load spikes, backfills, source delays, and warehouse queuing. Engineering leaders need three numbers for each data product, a p50 for the normal experience, a p95 for the expected operating bound, and a p99 for the failure-adjacent bound that still supports the business process.
These numbers must measure end-to-end time. The clock starts when the business event occurs, not when a connector sees the row, and it ends when the consuming system can use the data. Landing the event in object storage or a staging table is an intermediate step. A useful freshness SLO for a personalization feature is specific, such as “p50 under 10 seconds, p95 under 45 seconds, p99 under 3 minutes from product-view event to materialized user-session feature”. That statement gives architects enough precision to select Kafka, Kinesis, Flink, Materialize, Redis, DynamoDB, BigQuery scheduled queries, dbt, Airflow, Dagster, or cron-based ETL, and it tells product managers what user experience the system will support. Vendor evaluation should use the same language, since a partner that cannot state p50, p95, and p99 time from event ingestion to materialized feature lacks production depth in machine learning systems.
The p99 target matters because business systems fail at the tail. Checkout traffic spikes, warehouses queue queries, API connectors throttle, and mobile clients upload buffered events after the user returns online. Averages hide those failures, while tail measurements show whether the system supports the business process during the moments that create revenue, risk, or executive attention.
Freshness targets also set the incident threshold. If a p95 target is 15 minutes, an alert at 16 minutes carries operational meaning, while a generic “job failed” alert does not tell the owner whether any business decision missed its window. The alert needs to identify the consumer, the SLO, the stage, and the expected customer or business effect. The best SLOs also separate target and measurement period, so a p95 under 15 minutes measured over the last hour serves an operations queue while a p95 under 4 hours measured over a business day serves a sales dashboard. Both are valid, and each requires a different control loop.
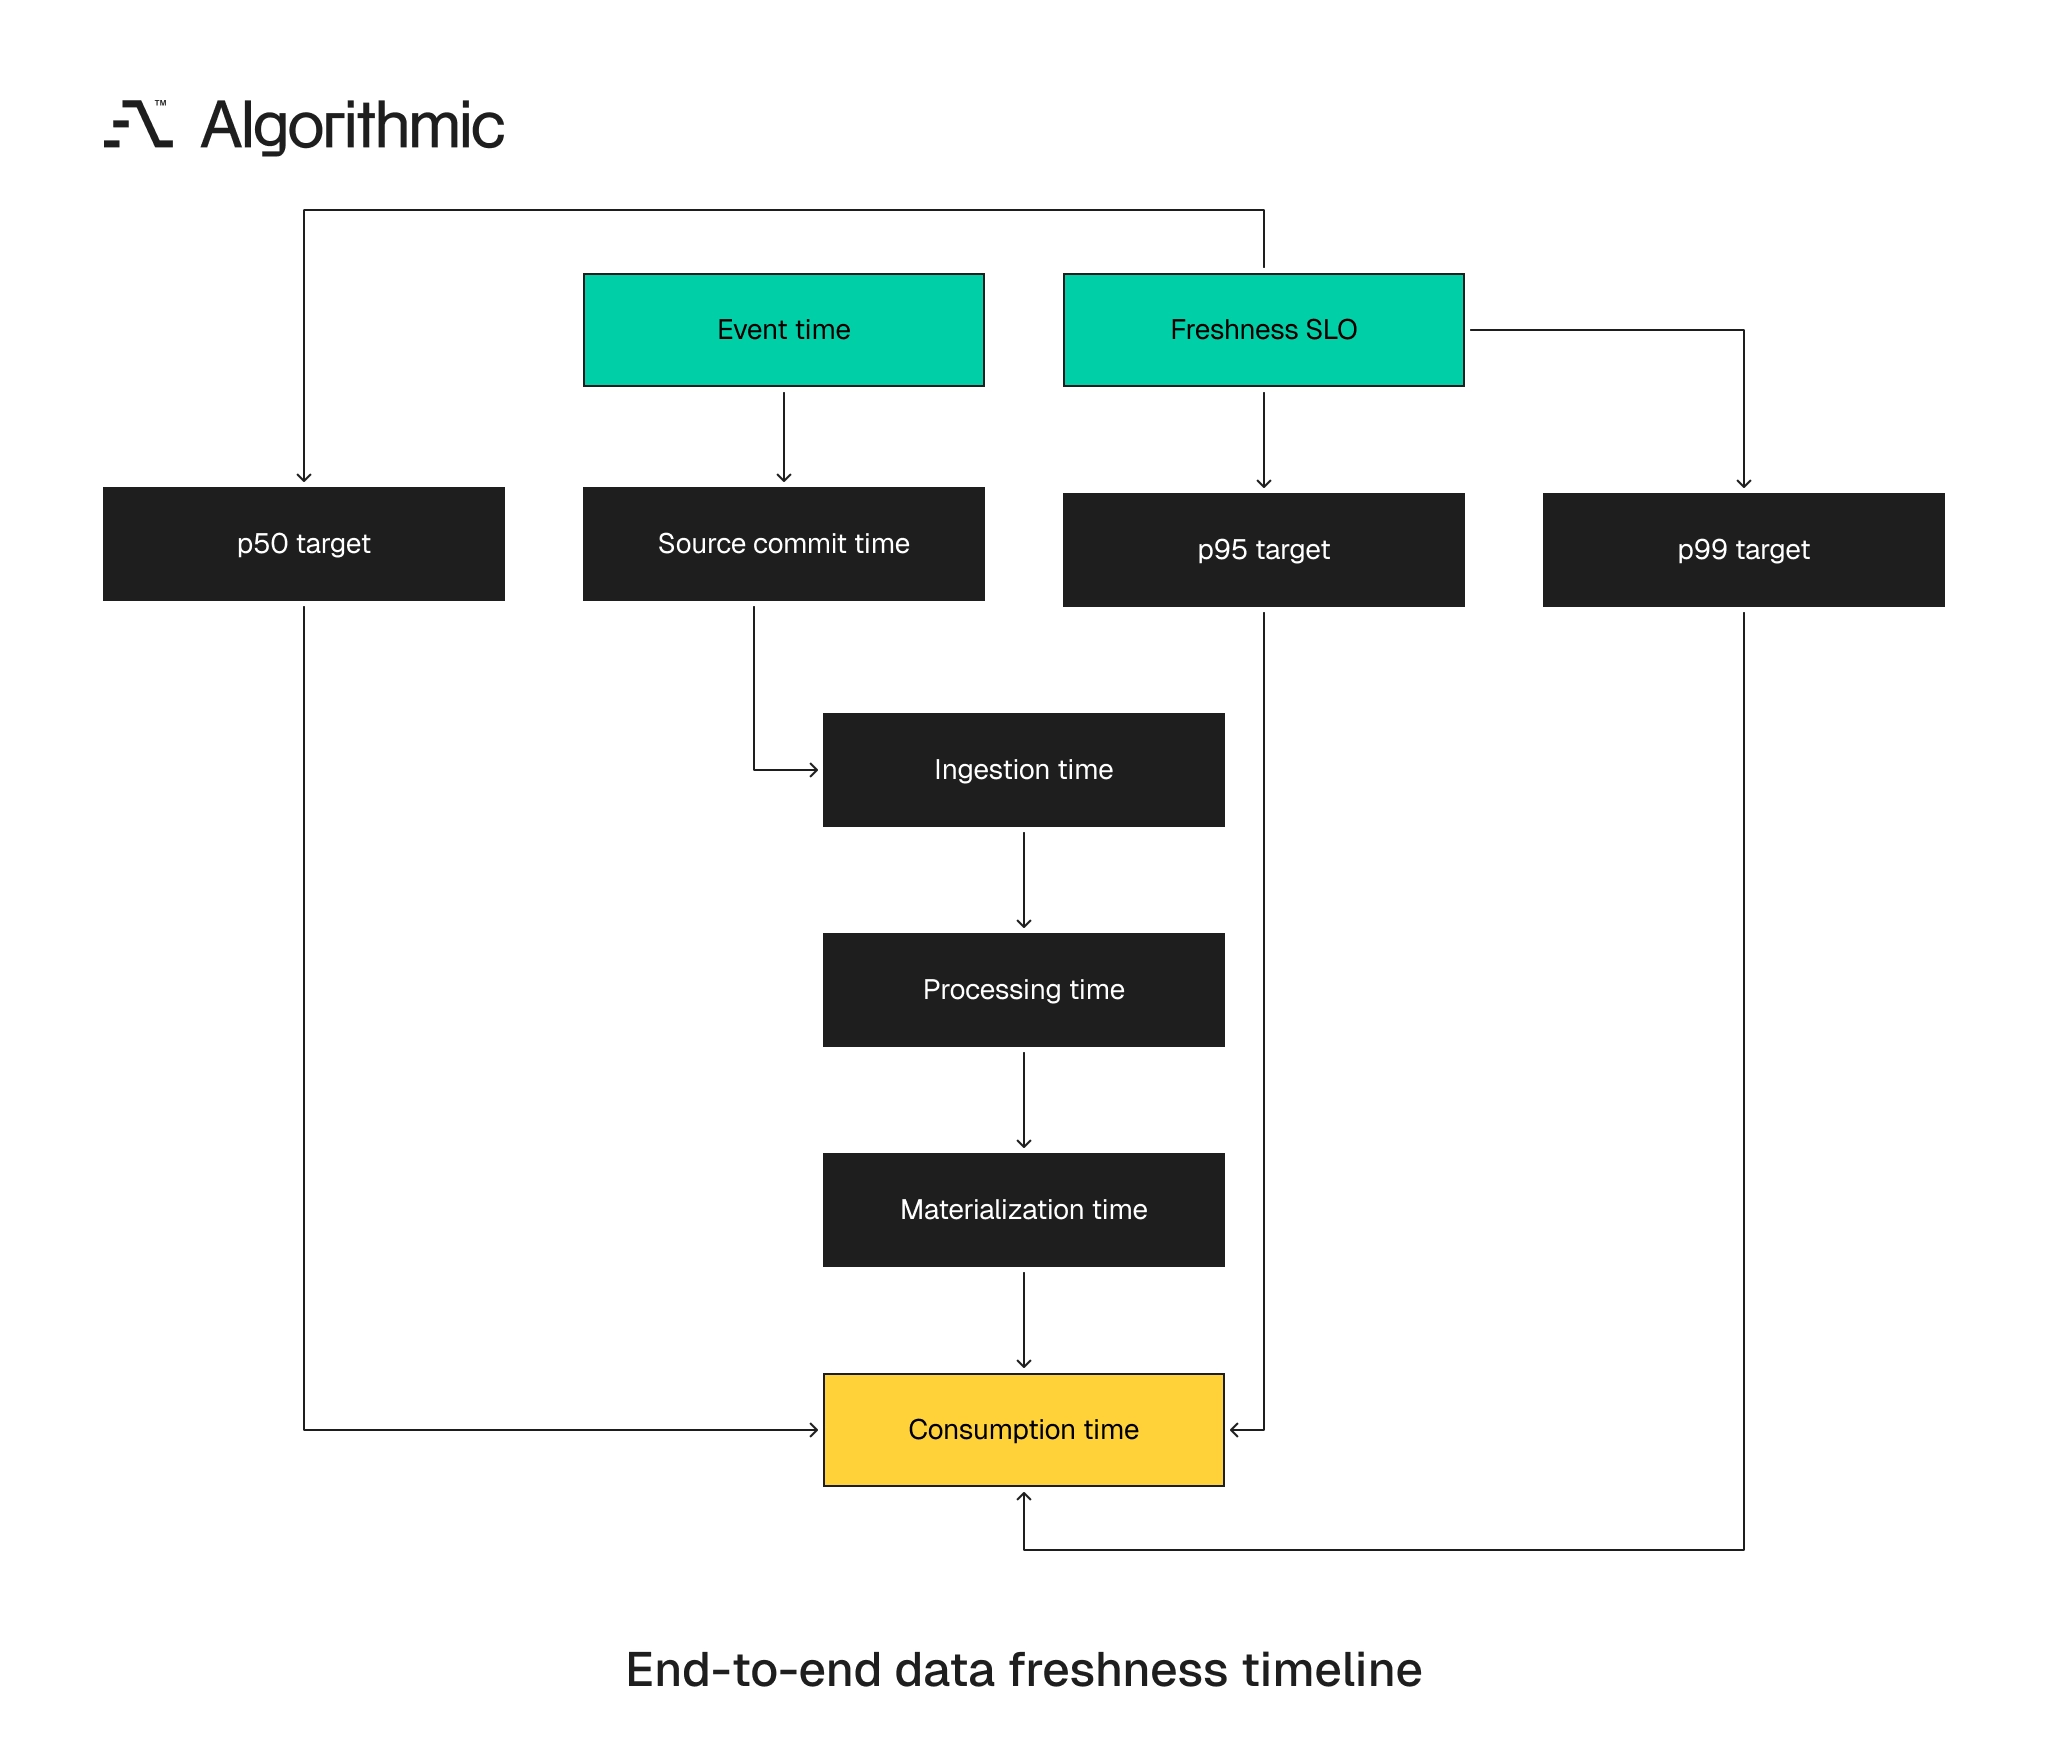
Percentiles also reveal false comfort in scheduled systems, since a job that runs every five minutes can still miss a 15-minute p95 if queue time and source lag consume the window. Teams should record the full path in the SLO, and a phrasing like “event time to source commit to ingestion to transformation to materialization to consumption” gives engineers stage-level visibility.
 Click to expand
That structure prevents premature tool replacement. If the delay sits inside a vendor API that publishes files two hours late, replacing the processing engine will not recover the SLO. The percentile target should align with the user impact. A support queue can tolerate a few stale cases during peak periods if escalation rules catch high-severity tickets, while a card authorization path has less room for tail failure, because the highest-latency percentile often contains the transactions with the largest losses, highest volumes, or most complex device histories. Measurement windows should be short enough to trigger response and long enough to avoid noise, so fraud systems need minute-level windows during peak periods while finance dashboards can use business-day windows.
A decision matrix for processing mode selection
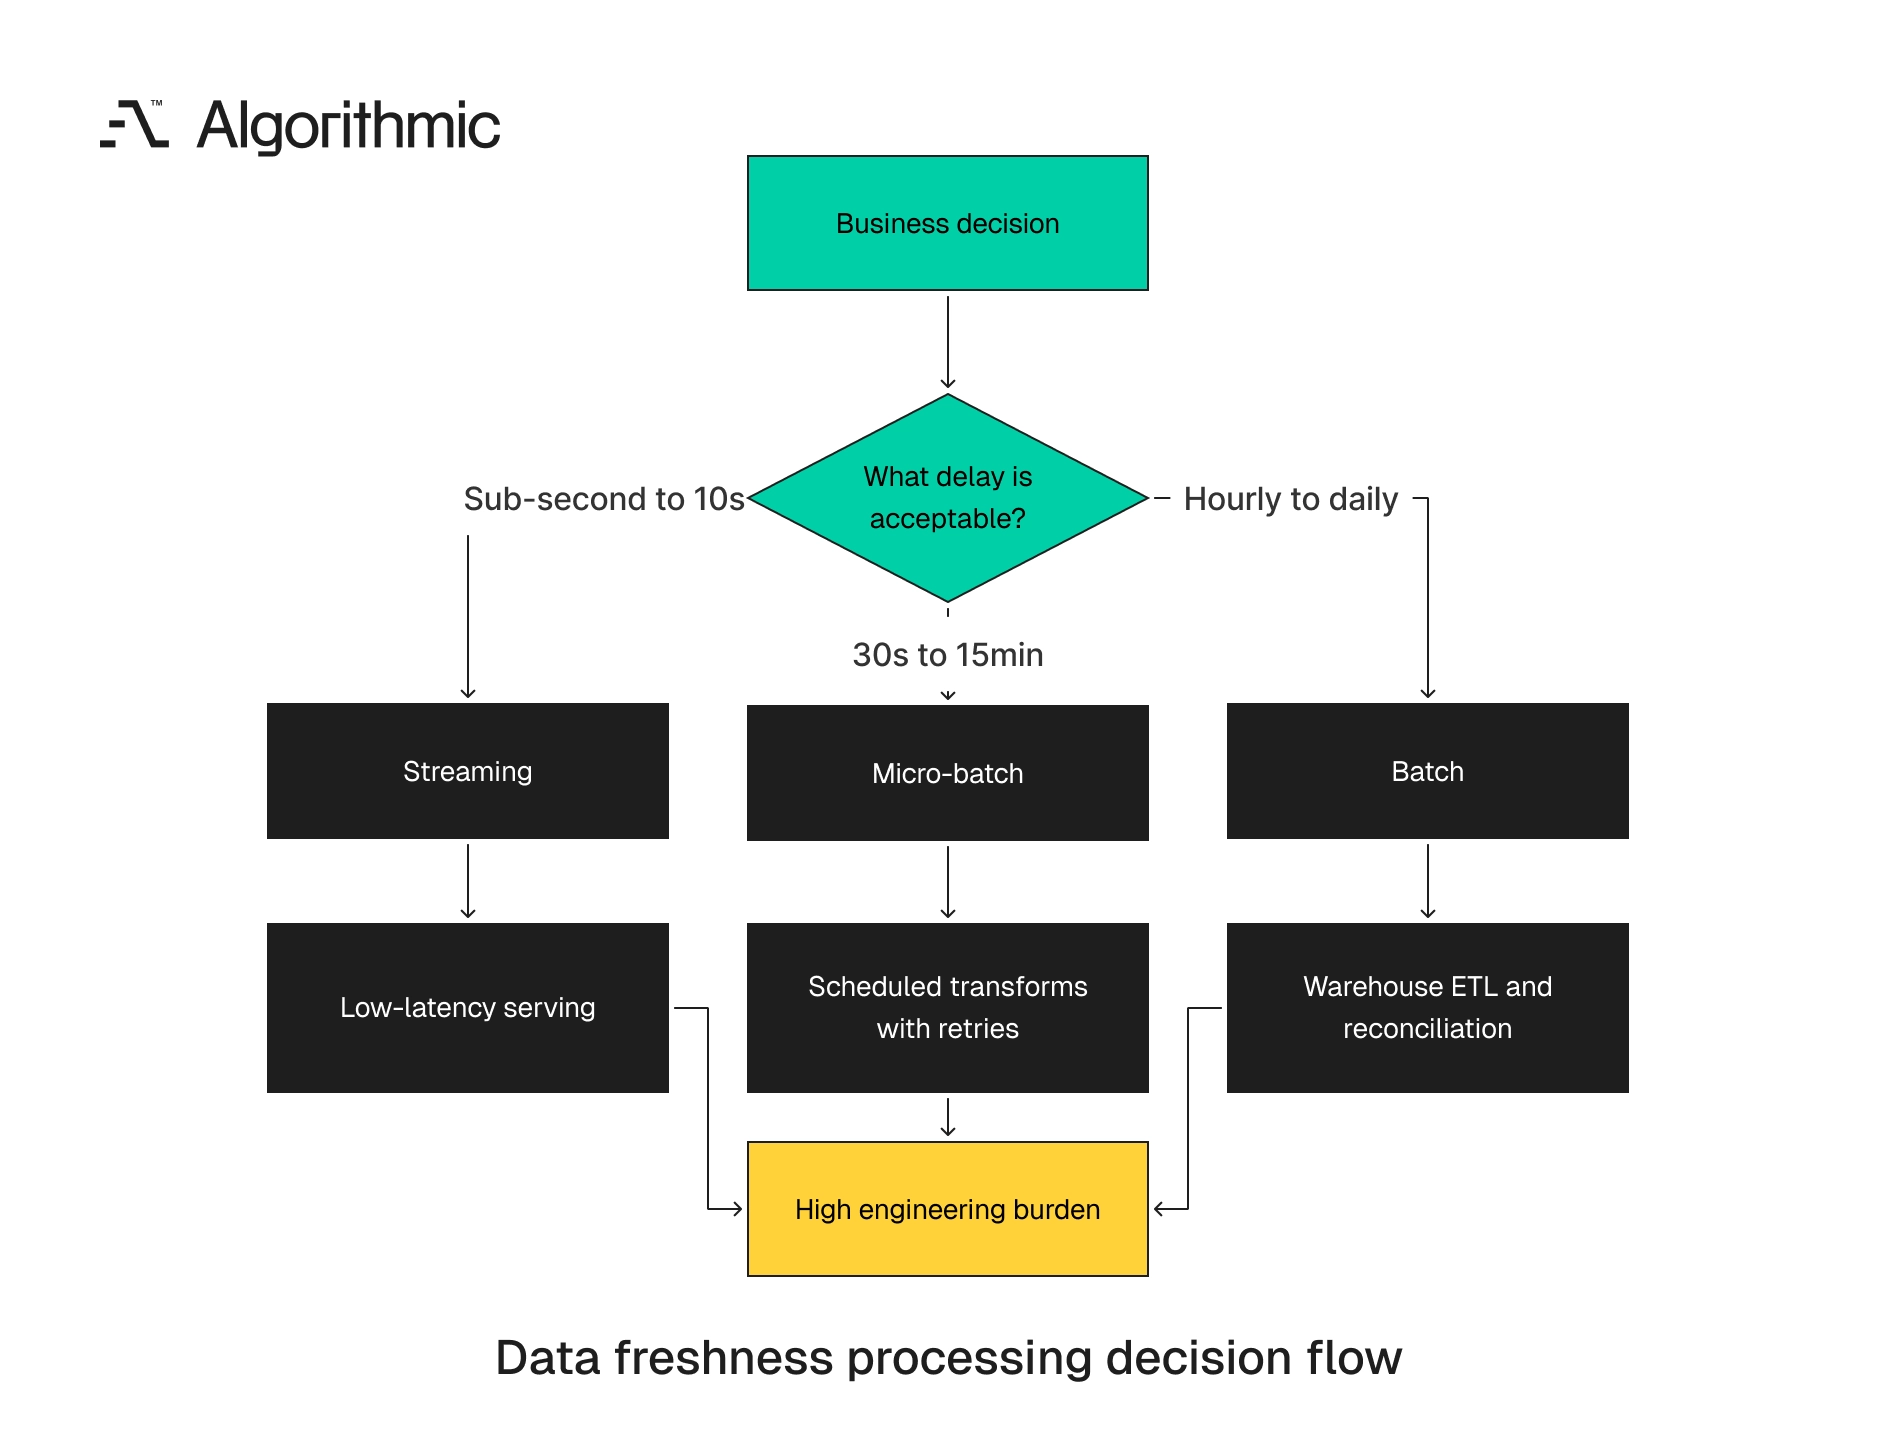
The processing model should be selected after the freshness SLO is written. The table below gives data platform teams a practical starting point for operational analytics and warehouse-backed products.
 Click to expand
| Business decision | Typical freshness SLO | Correctness priority | Processing model | Typical tooling |
|---|---|---|---|---|
| Card fraud authorization | p95 under 1 second, p99 under 3 seconds | High, with bounded approximation | Streaming | Kafka or Kinesis, Flink, Redis, feature store |
| Account abuse detection | p95 under 30 seconds, p99 under 2 minutes | High | Streaming or micro-batch | CDC with Debezium, Kafka, Flink, ClickHouse |
| Session personalization | p95 under 60 seconds, p99 under 5 minutes | Medium to high | Streaming or micro-batch | Kafka, Flink, DynamoDB, online feature store |
| Support ticket triage | p95 under 10 minutes, p99 under 30 minutes | Medium | Micro-batch | Snowpipe, BigQuery streaming inserts, dbt, Dagster |
| Sales pipeline dashboard | p95 under 2 hours, p99 under 6 hours | High | Batch or incremental batch | Fivetran, Airbyte, dbt, Airflow |
| Finance close reporting | p95 under 24 hours after cutoff | Highest | Batch | Warehouse ETL, dbt, reconciliation checks |
| Executive KPI dashboard | p95 under 4 hours or daily by 08:00 | High | Batch or incremental batch | Snowflake tasks, BigQuery scheduled queries, dbt |
This matrix also clarifies cost. A processing guide cites a case where a $2,400 per month streaming pipeline served a workload that an $80 batch query could handle because the dashboard refreshed every four hours. The exact cloud bill varies by vendor and volume, but the same pattern appears across platforms, since low-latency infrastructure carries a fixed operating floor. A separate decision framework estimates streaming at 5x the operating cost of batch and places micro-batching at about 50% of the cost and operational complexity of pure streaming for many workloads. The useful point is the cost structure, because streaming systems run continuously, and continuous systems require different staffing, monitoring, and failure response.
Streaming systems require state management, out-of-order event handling, schema discipline, replay policy, and stronger incident response runbooks. A batch system can fail at 01:00 and still recover before an 08:00 dashboard deadline, while a fraud stream has a narrower recovery window where a five-minute outage during card authorization creates denied customers, accepted fraud, or manual review volume.
The decision matrix should live in an architecture decision record, and each row should include a named owner and a date for review. Freshness requirements change when a product moves from internal reporting to customer-facing operations, so a dashboard used by five analysts can tolerate delays that a customer-facing alert cannot. The matrix also prevents tool sprawl. If three workflows sit in the 10-minute band, the team can standardize on one micro-batch pattern instead of maintaining separate custom pipelines.
The matrix should include a column for stale-data cost during internal reviews. A support workflow can express cost as SLA breach risk, escalation delay, or overtime hours, a fraud workflow as loss exposure, manual review load, and customer friction, and a finance workflow as close delay, rework hours, and audit exposure. This economic framing prevents technical preference from dominating the decision, so the platform funds low-latency infrastructure where the time window changes the business result.
The matrix also helps teams sequence migration work. A table serving both finance close and personalization should split into separate materializations with separate owners, which avoids an unstable compromise. Finance receives controlled batch reporting, and product receives a lower-latency feature path with its own correctness rules.
Temporal alignment creates more errors than processing speed
Freshness work fails when teams treat time as one timestamp column. Production systems need explicit time semantics across events, source commits, processing, reporting, and serving. These semantics affect reconciliation, feature training, incident response, and audit evidence, and they determine whether two correct reports disagree for legitimate business reasons. Stream processors formalize this with event time and watermarks, which declare how far event time has progressed independent of wall-clock arrival. The same mismatch drives forecast error, which we cover in how date alignment in analytics reduces forecast errors.
Event-date and report-date serve different purposes
Event-date answers when the customer action occurred, while report-date answers when the system learned about it or when the metric became eligible for reporting. A payment attempted at 23:58 UTC and settled at 00:04 UTC crosses a reporting boundary, so a dashboard grouped by event-date will show one result and a finance report grouped by settlement date will show another. Both results are correct when the metric definition states the time basis, because the same transaction belongs to different reporting views when the business questions differ. Product teams ask when the user acted, while finance teams ask when the transaction settled.
The same issue appears in marketing attribution, claims processing, marketplace payouts, and subscription revenue recognition, so data warehouse architecture must model these dates as separate fields. Transformation logic should preserve the distinction, since a single created_at field cannot carry event time, booking time, settlement time, and reporting eligibility. A subscription cancellation shows this, where the user clicks cancel on March 31, the entitlement ends on April 30, and the invoice adjustment posts on May 2. Product analytics, revenue recognition, and customer success reporting need different dates from the same event chain, so a clean model stores each date with an explicit name and definition.
A marketplace payout has the same structure. The buyer pays on Monday, the seller ships on Wednesday, delivery confirms on Friday, and payout clears the following Tuesday. Growth teams will attribute demand to Monday, operations teams will measure fulfillment against Wednesday and Friday, and finance will report cash movement on Tuesday. The warehouse should expose those dates separately, since combining them into one timestamp forces downstream teams to reinterpret business events through incomplete data. A strong semantic model also records timezone rules, so retail operations can use local store time while finance uses UTC or the corporate reporting timezone. Daylight saving changes create real defects when teams skip this rule, because a one-hour shift can duplicate or omit orders in hourly reporting during the transition.
Reporting delays need explicit lag windows
Late-arriving data is normal. Mobile clients buffer events, payment processors send delayed webhooks, CRM fields update after sales operations review, and warehouses queue work during peak load. These delays occur in healthy systems, not only during incidents. A mature model measures lag distribution by source, so if 92% of events arrive within 5 minutes, 98% within 30 minutes, and 99.7% within 6 hours, the freshness SLO and reporting rules should reflect that distribution. This is where batch processing wins for finance and executive analytics, because a dashboard that waits for a 2-hour lag window can be more trustworthy than a continuously refreshed dashboard that changes historical numbers every few minutes.
Lag windows should be visible to consumers. A dashboard can label today’s revenue as provisional until 14:00 UTC and final after the delayed processor feed lands. That contract removes ambiguity for finance, sales, and executive users, and it reduces the number of reconciliation conversations after weekly reporting meetings. Source systems need separate lag profiles, since Salesforce opportunity updates, Stripe settlement events, Segment product events, and ERP journal entries will not arrive with the same timing. One freshness SLO across all sources produces false precision, so the better design records lag distribution and data completeness for each source that feeds a metric.
Lag windows also affect backfills, so a seven-day attribution model needs a different correction policy than a same-day support queue. The policy should define when historical data changes. A marketing dashboard can allow seven days of attribution correction, then freeze campaign performance for standard reporting. Finance reporting usually needs a controlled correction path where adjustments flow through journal entries, reconciliation tables, or approved restatements, while operational queues need a shorter correction loop where a stale escalation score updates quickly and old queue rankings lose value after the work is assigned.
Lag windows also protect executive communication. A daily metric that becomes final at 08:00 should not keep changing throughout the day because late sources continue to arrive. The dashboard should show status as provisional, final, late-source warning, or source unavailable, and these labels make freshness visible to the people who use the numbers.
Feature engineering must respect operational lags
ML features need the same discipline, since a model trained on features that include data unavailable at inference time will show inflated offline performance and weaker production behavior. A support triage model trained with “refund issued within 24 hours” as an input has leakage if that field is unavailable when the ticket first arrives, so the correct feature uses only data known at triage time. The feature store should record both event time and materialization time, which keeps training and serving datasets aligned under the same operational facts. This alignment is where feature engineering decides machine learning outcomes, because a leaked or stale feature quietly reshapes production behavior.
A fraud model has the same constraint. A chargeback label arrives days or weeks after the transaction, so it belongs in training data and must stay out of features used during authorization. Authorization features must reflect account, device, merchant, velocity, and history available at decision time. The production requirement is stricter than offline accuracy, since the feature must be fresh enough for the decision and correct under the same time rules used during training. Training-serving alignment also requires versioned feature definitions, so if a feature changes from a 7-day window to a 24-hour window, historical training sets need the prior definition preserved. Freshness telemetry without feature versioning leaves model owners unable to explain production drift, so a model registry, feature registry, and lineage graph should point to the exact feature code used for each model version.
This discipline matters during audits and incident reviews. When a model denies an account or flags a transaction, the organization needs to reconstruct the features available at that moment. ML teams should treat feature materialization as a production contract that states source tables, time windows, watermark rules, and online serving latency. Feature monitoring should include stale-feature rates by model version, since a fraud model with 2% stale velocity features can produce a concentrated loss pattern during traffic spikes. Offline evaluation should use the same lag profile as production, because training that assumes perfect source availability overstates model performance. A point-in-time join is the minimum standard, so the training row joins only to feature values available at the decision timestamp.
The architecture should match the SLO band
Freshness SLOs create four practical architecture bands that give teams more precision than a binary streaming-versus-batch debate. Each band carries a different engineering burden, so the decision should account for latency, correctness, incident response, team skills, and audit requirements.
Sub-second to 10-second freshness
This band fits fraud authorization, live bidding, operational risk scoring, and high-value personalization. The architecture usually includes event ingestion through Kafka, Redpanda, Kinesis, or Pulsar, plus stateful processing through Flink, Kafka Streams, or Spark Structured Streaming. The processing layer must handle ordering, state, retries, and backpressure under peak load. Serving requires a low-latency store such as Redis, DynamoDB, Cassandra, ScyllaDB, or an online feature store, and that store must support predictable read latency under peak traffic, since high average throughput alone does not protect checkout, payout, or bidding decisions.
The engineering burden is material. Teams must handle replay, idempotency, schema evolution, exactly-once or effectively-once semantics, watermarking, backpressure, and state recovery. On-call coverage must include engineers who can debug partitions, consumer lag, checkpoint failures, and hot keys at 02:00, so a platform with no trained incident owner should not process authorization decisions. This band also needs disciplined schema governance, because a deleted field in a Kafka topic can break a fraud model in seconds. A schema registry, compatibility checks, contract tests, and staged rollout process are operating requirements, and event producers should publish versioned contracts before downstream consumers depend on new fields.
Capacity planning must include burst traffic, since a retail checkout stream on Black Friday or a ticketing platform during an onsale event will not resemble a normal Tuesday. The freshness SLO must hold during the business events that matter most, so testing against average traffic gives the team confidence in the wrong operating condition. The architecture also needs replay limits, because a replay of 30 days of events can overload consumers, poison online stores, or trigger duplicate alerts if idempotency is incomplete.
This band also needs clear degradation rules. If the feature store misses its freshness SLO, the decision service should use a documented fallback. A fraud system can route to manual review, use a lower-confidence model, or apply conservative rules for specific transaction types, and that fallback should be tested before an incident. Data contracts need ownership at both producer and consumer boundaries, since a mobile app, payment gateway, account service, and risk model all change on different release cycles.
30-second to 15-minute freshness
This band fits support triage, abuse queues, inventory alerts, customer health scoring, and near-real-time operations dashboards, and micro-batch gives the right balance for many of these workflows. Common designs include CDC from Postgres or MySQL through Debezium, staged files in S3 or GCS, Snowpipe or BigQuery streaming ingestion, and transformations on 1-minute, 5-minute, or 15-minute schedules. Orchestration through Dagster, Airflow, Prefect, or warehouse-native tasks can meet the SLO without a full streaming stack, and tools like dbt microbatch incremental models split processing into bounded time windows keyed on event time. Micro-batch also improves recoverability, since failed runs can be retried with bounded windows, data quality checks can run at each materialization point, and backfills are easier to reason about than replaying a long-lived stream with stateful joins. The common lesson is that scheduling and orchestration delays create the freshness miss before processing speed becomes the constraint.
In this band, the warehouse can remain the central control point, so teams can keep dbt models, data tests, and lineage in one place while shortening schedules for selected tables. That architecture reduces operational load compared with a separate streaming topology, and it lets analytics engineers work within familiar deployment and review workflows. Micro-batch design still needs clear boundaries, because a 5-minute schedule on a transformation that takes 7 minutes creates permanent overlap. The team should size the window, compute time, retry policy, and alert threshold together, and a runbook should state when to skip, merge, or replay windows after failure.
Micro-batch also needs source completeness checks, since a five-minute job that runs on incomplete API extracts produces fresh data with poor correctness. This band often exposes orchestration defects, because a schedule that starts every five minutes can miss the SLO if upstream extracts arrive at irregular offsets. Teams should measure queue time separately from processing time, which shows whether the scheduler, warehouse, ingestion layer, or transformation code owns the delay. Micro-batch works best when writes are idempotent, so the target table tolerates reruns for the same window without duplicate rows or inconsistent aggregates. A support queue shows the pattern, where tickets move through ingestion every two minutes, features refresh every five minutes, and priority scores publish every ten minutes. That design gives supervisors a current queue without Kafka, Flink, and online state management, and it keeps incident recovery within tools the analytics team already operates.
Hourly to daily freshness
This band fits finance reporting, executive dashboards, account segmentation, board metrics, and most business intelligence engineering, where batch and incremental batch provide better cost control and stronger auditability. The design should focus on dimensional modeling, dbt transformations, data quality monitoring, lineage, reconciliation, and clear ownership of metric definitions, and the key reliability test is whether the dashboard is correct by 08:00 each business day. Event-by-event streaming is unnecessary for that SLO, so the platform should spend engineering effort on correctness, source coverage, and metric governance. Hourly batch can still be production-grade with SLAs, alerts, runbooks, source freshness checks, and tests for null rates, duplicate keys, row count variance, and referential integrity.
A daily executive KPI table should have a named owner, a certified definition, and a documented cutoff, and it should state which sources are included, which sources lag, and when numbers become final. This level of discipline creates more trust than a dashboard that refreshes every minute with unstable definitions, since executives care about a number they can act on and defend. Incremental batch has a strong fit when full rebuilds exceed the SLO window, because dbt incremental models, partitioned BigQuery tables, Snowflake streams and tasks, and Iceberg table maintenance can reduce compute without adopting continuous processing. The control plane remains understandable to analysts and analytics engineers, which matters because finance, sales operations, and data teams often share responsibility for these tables. Batch design also benefits from certification, so a certified revenue table exposes the run identifier, upstream source versions, test results, and approval status.
Hourly and daily systems still need capacity planning, since a warehouse that runs cleanly on Monday can queue for 40 minutes during month-end close. The team should test the schedule under peak workloads, because month-end, quarter-end, large product launches, and annual planning cycles create different warehouse contention patterns. Batch reliability also depends on source contracts, so a CRM export that arrives at 06:45 on normal days and 08:30 during quota updates can break an 08:00 executive dashboard. The correct response is a source SLO and a publication rule, and if the source misses its delivery window the dashboard should show a clear status instead of silent staleness.
Weekly and ad hoc freshness
Some datasets have no standing freshness SLO beyond availability for a scheduled review, and board packets, annual planning models, compensation analysis, and regulatory extracts fall into this group. These workflows need version control, approval, and reproducibility rather than a continuous ingestion path. A signed-off snapshot with reconciliation evidence is more useful than a moving table, since the organization needs to know which number was approved, when, and by whom. The architecture should prioritize reproducible runs, immutable snapshots, and clear data lineage, so teams store the query version, source table versions, run time, and approver. That record protects the organization when a number is questioned weeks later, and it reduces the cost of external audits, compensation disputes, and board follow-up questions.
Ad hoc analysis still needs engineering discipline, so a one-time extract used for pricing, compensation, or regulatory reporting should carry the same timestamp and source version discipline as a scheduled table. These workflows often fail through spreadsheet drift, where one analyst refreshes a workbook after approval while another uses the signed-off version in a board appendix. The solution is a controlled snapshot with a durable identifier that appears in the workbook, the presentation, and the warehouse table. Approval workflows should be explicit, so a compensation analysis records the input period, quota version, employee roster version, query hash, reviewer, and approval timestamp. Weekly and ad hoc data products also need retention rules, and audit-heavy organizations should retain the exact snapshot used for decisions, not only the latest source data.
Freshness SLOs require measurement, alerts, and ownership
A freshness SLO without instrumentation is a planning artifact. Production data systems need freshness telemetry at each stage.
Measure these timestamps for every critical table, feature, and dashboard:
- Event time: when the business action occurred.
- Source commit time: when the source system recorded it.
- Ingestion time: when the pipeline received it.
- Processing time: when transformations completed.
- Materialization time: when the consumer could query or serve it.
- Consumption time: when the dashboard, model, or workflow used it.
The difference between event time and materialization time is the primary freshness measure, the difference between source commit time and ingestion time identifies connector or CDC delays, and the difference between processing time and materialization time identifies warehouse queuing, index build time, or feature store write delays. These measurements tell the team where to intervene.
Alerts should fire on SLO burn, not on generic job failure alone, since a job can succeed and still deliver data too late, and a pipeline can fail and remain within SLO if retries complete inside the window. The alert policy should reflect business risk, not the presence of a red task in an orchestrator. Treat freshness with the same rigor SRE applies to availability and latency, with a target, a measurement, an alert, an owner, and a review cadence. Instrumentation should be built into the pipeline from the start, so each materialized table exposes maximum event time, materialization time, row count, and source coverage. Dashboards should display the last successful refresh and the freshness status of their critical inputs, because a green dashboard built from stale inputs gives users false confidence.
Ownership must be explicit, so a freshness alert for a revenue table routes to the data product owner, not a generic data engineering channel. The owner must have authority to change schedules, pause publication, or coordinate with the source system team, since alert routing without decision authority creates noise. Freshness metrics should also enter incident reviews, where a post-incident review names the missed SLO, affected consumers, cause stage, detection time, recovery time, and prevention action. This record builds a data reliability history, and over time the team learns whether misses come from sources, ingestion, transformation, materialization, or consumption.
Measurement design should account for late data and clock skew, since event producers, databases, warehouses, and serving stores can disagree on time when clocks drift or timestamps use different zones. Teams should standardize timestamp fields and store timezone metadata, because UTC storage with explicit local-time presentation prevents many reporting defects. Freshness instrumentation should also track data completeness, since a table can be fresh by timestamp and incomplete by source coverage. A revenue dashboard can refresh at 08:00 while missing one payment processor, so the freshness indicator should show both timeliness and coverage. Coverage metrics should state expected sources and observed sources, and if Stripe, Adyen, and PayPal feed the metric, the dashboard should show whether all three arrived. Alert severity should follow decision impact, so a stale board dashboard at 06:00 may be medium severity if the board packet is due at noon, while a stale fraud feature during checkout traffic deserves a higher severity that routes to the team able to act within the required window.
Cost estimates must include engineering operations
Cloud invoices capture part of the cost, since streaming systems also require senior engineering time. A production streaming platform needs schema registry management, replay strategy, dead-letter queues, watermark policy, state checkpointing, consumer lag alerts, versioned transformations, and incident response runbooks. These are required controls for systems that drive fraud decisions, personalization, or operational alerts. The latency and throughput tradeoff that Martin Kleppmann describes for stream processing is not a tuning detail, it is the reason continuous systems cost more to run. Batch systems have their own costs, including warehouse compute, orchestration, backfills, data quality failures, and delayed decisions, but the operating model remains simpler for workloads with hourly or daily freshness SLOs.
A practical cost model should include:
- Monthly platform cost for brokers, processors, storage, warehouse compute, and serving databases.
- Engineering hours for build, maintenance, incident response, and backfills.
- On-call load for stateful services and time-sensitive workflows.
- Business cost per minute, hour, or day of stale data.
- Audit and reconciliation cost for correcting historical metrics.
- Migration cost when the initial architecture misses the required freshness band.
The last item is often the most expensive. Replacing a batch pipeline with streaming after the data model is built can require event schema redesign, source CDC setup, feature recomputation, and downstream contract changes. Moving from streaming back to batch can be politically harder because teams have already absorbed the infrastructure cost, and stakeholders equate tool removal with regression unless the SLO evidence is explicit.
Cost analysis should include team shape. A two-person analytics engineering team can operate hourly dbt jobs with warehouse-native alerts, but the same team will struggle to own Flink state, Kafka partitioning, schema compatibility, and 24/7 incident response, since those duties require platform engineering depth and production operations maturity. Tooling procurement can hide the labor cost, because a managed Kafka service removes broker maintenance while the team still owns event contracts, consumers, replay, stateful jobs, and data correctness. Managed infrastructure reduces platform work, but it does not remove data engineering responsibility or the need for senior ownership during incidents.
Business cost should be quantified before architecture selection, since a fraud decision delayed by 30 seconds has a different economic profile than a sales dashboard delayed by 30 minutes. The architecture should reflect the money at risk, because pipeline elegance has no value when the business decision does not require that freshness. A useful model converts delay into dollars or risk units, so fraud teams estimate loss exposure per delayed authorization, support teams estimate SLA breach cost per delayed escalation, and finance teams estimate reconciliation effort by analyst hours and close-cycle delay. These numbers make the processing decision concrete.
The cost model should include incident frequency assumptions, since a streaming system with one high-severity incident per quarter carries an on-call and executive escalation cost. It should also include test environment cost, because streaming systems need lower environments that test schema changes, replay, checkpoint recovery, and consumer behavior. Batch platforms need test data, dependency checks, and backfill validation, and those controls are cheaper than a parallel streaming topology for many reporting workloads. Licensing terms also affect architecture, since some vendors charge by event volume, some by compute time, and some by stored data. A micro-batch design can lower event-processing cost by aggregating work into fewer compute runs, while a streaming design can lower decision latency when each event changes an operational action.
Cost reviews should occur after production data arrives, because a pre-launch estimate rarely captures source lag, retry volume, skewed keys, or backfill frequency. The review should compare actual freshness distribution against actual operating cost, so if a four-hour dashboard runs on a continuous stream, the team documents why that cost remains justified.
A five-step method for selecting a processing mode
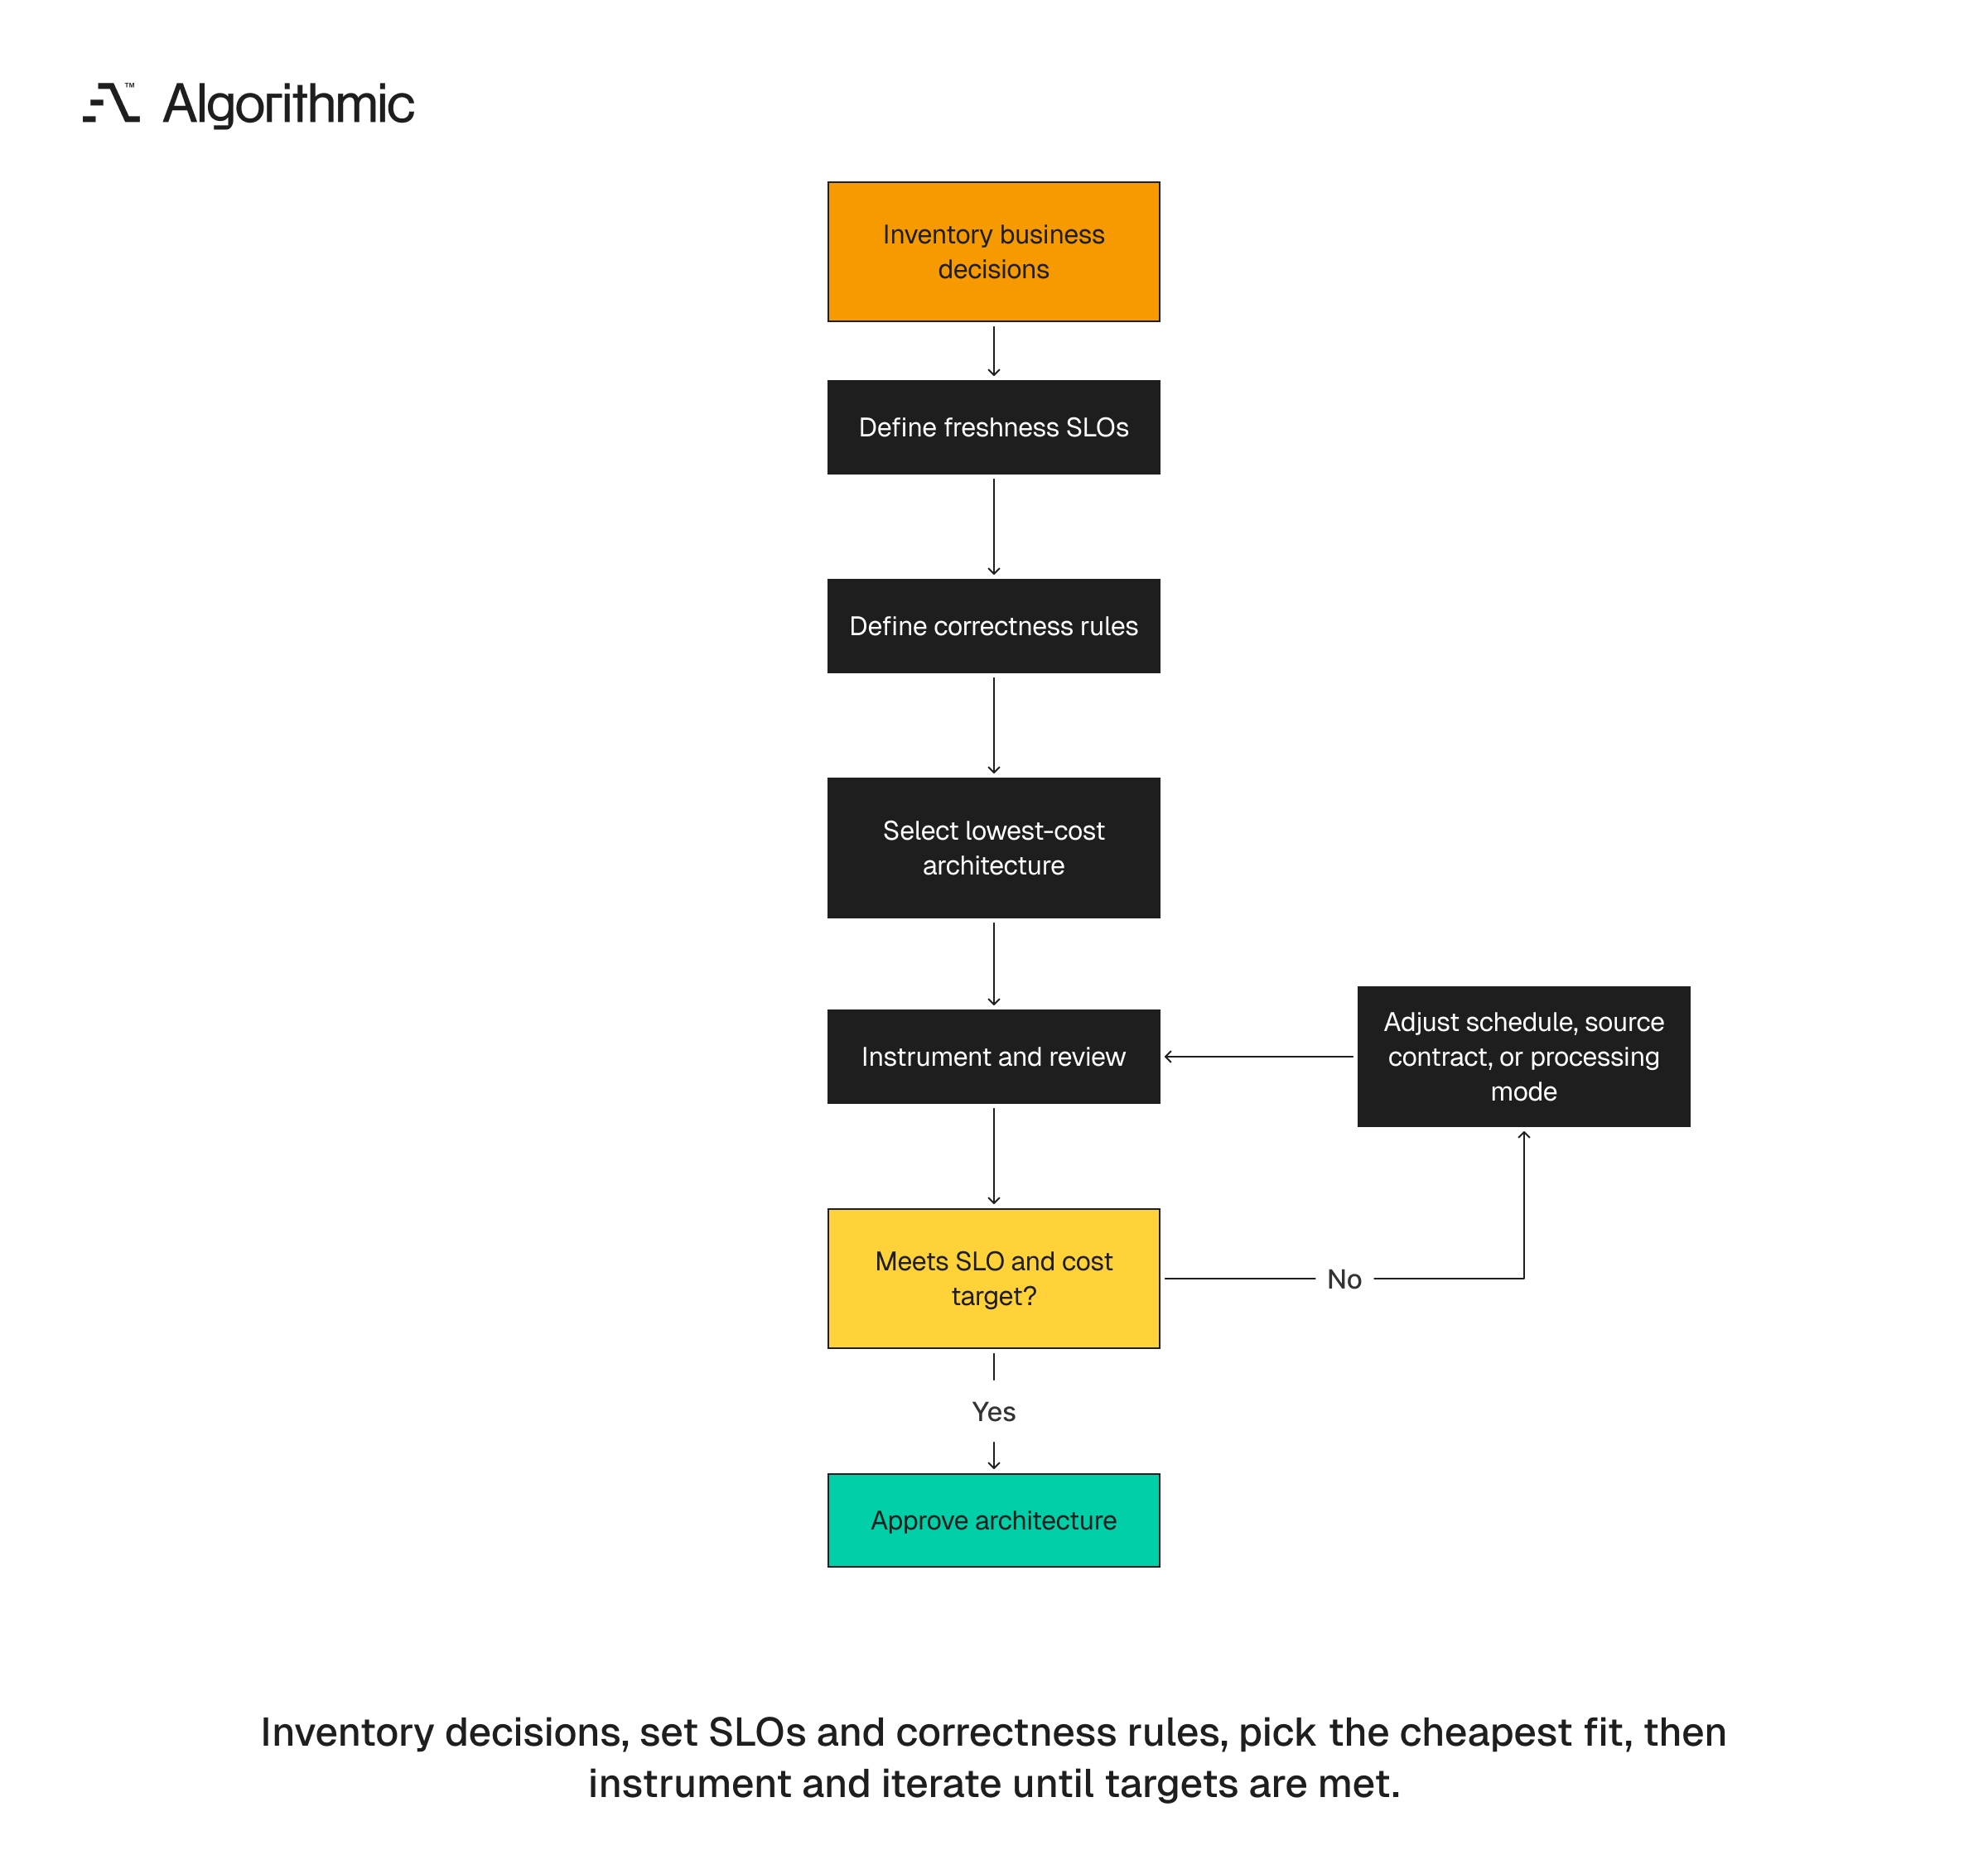
Data infrastructure leaders should decide processing mode through a short, documented method that lives in an architecture decision record. The method should be lightweight enough to use during delivery, since a two-week architecture delay is unnecessary for a small dashboard while a one-page decision record prevents expensive mistakes.
 Click to expand
1. Inventory business decisions
List every downstream decision that uses the data, and separate fraud holds, support queue ranking, pricing changes, finance close, executive reporting, and ML inference. Do not assign one freshness target to an entire domain, since a customer table can feed a daily revenue dashboard and a same-session personalization model. The inventory should name the consumer system, because a decision served by a dashboard, a feature store, a ticketing queue, and a finance workbook will have different operating requirements. The owner should document each consumer separately, with the business owner, technical owner, consuming system, decision frequency, and consequence of stale data.
This inventory often exposes duplicated pipelines, since two teams frequently compute similar customer health fields with different schedules, tests, and definitions. A shared inventory gives the platform team a path to consolidate around the decision with the strictest validated SLO, and it prevents accidental downgrades for stricter consumers. The inventory should include manual decisions as well as automated ones, because a human supervisor using a queue view and a finance analyst using a workbook both depend on data freshness. The delivery mechanism changes, while the decision still needs a stated time window. The inventory should also identify consumers that read the same table for different purposes, which often calls for separate serving tables, semantic views, or certified aggregates.
2. Define freshness SLOs
For each decision, specify p50, p95, and p99 freshness from event time to materialization time, and state the unit as seconds, minutes, hours, or business days. Also state the tolerance for late-arriving data, since a dashboard can show provisional numbers for two hours and final numbers after 24 hours if that contract is explicit. The SLO should include peak-period expectations, because a payment platform, retailer, or marketplace should test freshness during known high-volume periods. Normal-day measurements alone understate the engineering requirement, so load tests should use production-like event distribution, including hot accounts, bursty sources, and delayed mobile uploads.
The SLO should name the measurement window, since a 99th percentile measured over five minutes tells a different story than the same percentile measured over a week. For launch, weekly review of p50, p95, and p99 is enough for most analytics products, while fraud, abuse, and checkout systems need continuous tail monitoring. The SLO should include publication rules that state whether a dashboard publishes stale data, freezes the last certified value, or hides affected metrics. Operational APIs need similar rules, so if a feature misses its freshness target the API returns a fallback, routes to manual review, or declines the request based on policy. SLOs should also name their exceptions, since planned maintenance, source outages, and regulatory blackout periods need documented treatment before they occur.
3. Define correctness rules
Document event-date versus report-date, deduplication keys, watermark rules, replay behavior, and accepted lag windows, since these rules determine whether the pipeline remains trustworthy under delay. For ML systems, record which features are available at inference time and which fields are excluded because they arrive later. Correctness rules need ownership, so finance signs off on settlement-date definitions, risk signs off on fraud label timing, and product analytics signs off on event-time attribution.
Deduplication deserves explicit treatment, because payment systems deliver duplicate webhooks, mobile apps resend buffered events, and API syncs repeat changed records. A pipeline that meets its freshness target while double-counting revenue has failed the business process, so freshness and correctness must be measured together for critical data products. Replay rules also belong in the decision record, and a replay should state which partitions, time windows, and consumers receive corrected data. Watermark rules should be written in business terms, since “orders remain provisional for two hours after event time” is clearer than a buried processing parameter.
The team should document correction rules for late data, since a late order can update today’s provisional dashboard, last week’s attribution table, or a correction ledger. Each choice has a business consequence, so finance teams need controlled restatement while operations teams often need the latest known state. Correctness rules should also include privacy and retention constraints, because some event streams contain personal data that should not be replayed broadly or retained indefinitely.
4. Select the lowest-cost architecture that meets the SLO
Use streaming for sub-second and low-second decisions, micro-batch for minute-level operational workflows, and batch or incremental batch for hourly and daily analytics. This keeps infrastructure aligned with the value of freshness, and it protects senior engineers from operating a continuous processing system for a dashboard reviewed once per week. Senior engineering time should be assigned where the decision window creates economic value.
The selected architecture should include a rollback plan. Streaming deployments need replay and state recovery procedures, batch deployments need backfill procedures and snapshot controls, and micro-batch deployments need retry windows, idempotent writes, and skip rules for overloaded schedules. Architecture selection should include data contract review, since if the source cannot provide stable event schemas or reliable CDC, streaming adoption will expose upstream weaknesses quickly. A team should fix source contracts before placing operational decisions on a stream, otherwise the streaming system becomes a faster path for defective data.
The architecture decision should name the operating team, because a system with no owner for nights, weekends, and source failures is incomplete. Tool choice should follow existing operational skill where the SLO allows it, so a team with strong warehouse operations can meet 10-minute SLOs through micro-batch without new stateful processing, while a team with mature Kafka and Flink operations can use that foundation for low-latency decisions. The decision record should explain how the chosen pattern meets the SLO and correctness rules.
5. Instrument and review
Measure freshness distribution in production, and review p50, p95, and p99 weekly during launch and monthly after stability. If p99 misses the target, identify the stage causing delay before changing tools, since the cause is often source lag, warehouse queuing, orchestration timing, or late-arriving events. The processing engine itself is only one part of the path, so replacing dbt with Flink will not fix a vendor API that publishes files two hours late.
Reviews should produce decisions, not status updates, so the team adjusts schedules, resizes warehouses, changes ingestion paths, amends lag windows, or revises SLOs based on measured data. A freshness register that receives no updates becomes shelfware, and the register should change when consumers change, sources change, or the business value of freshness changes. Review meetings should include the owner who can accept risk, because a data engineer can report a missed SLO but finance or risk must decide whether provisional publication is acceptable. The review should include cost and incident data, since a system that meets p95 while missing p99 every Friday needs a targeted fix, not a broad platform rewrite.
The team should record every accepted exception, because repeated exceptions signal that the SLO, source contract, or architecture no longer matches production reality. Instrumentation should also cover consumer behavior, so if no one opens a dashboard before noon, an 08:00 freshness target deserves review. That review should use evidence, not preference, and access logs, decision timestamps, and business owner sign-off should guide the change.
The architecture decision should be auditable
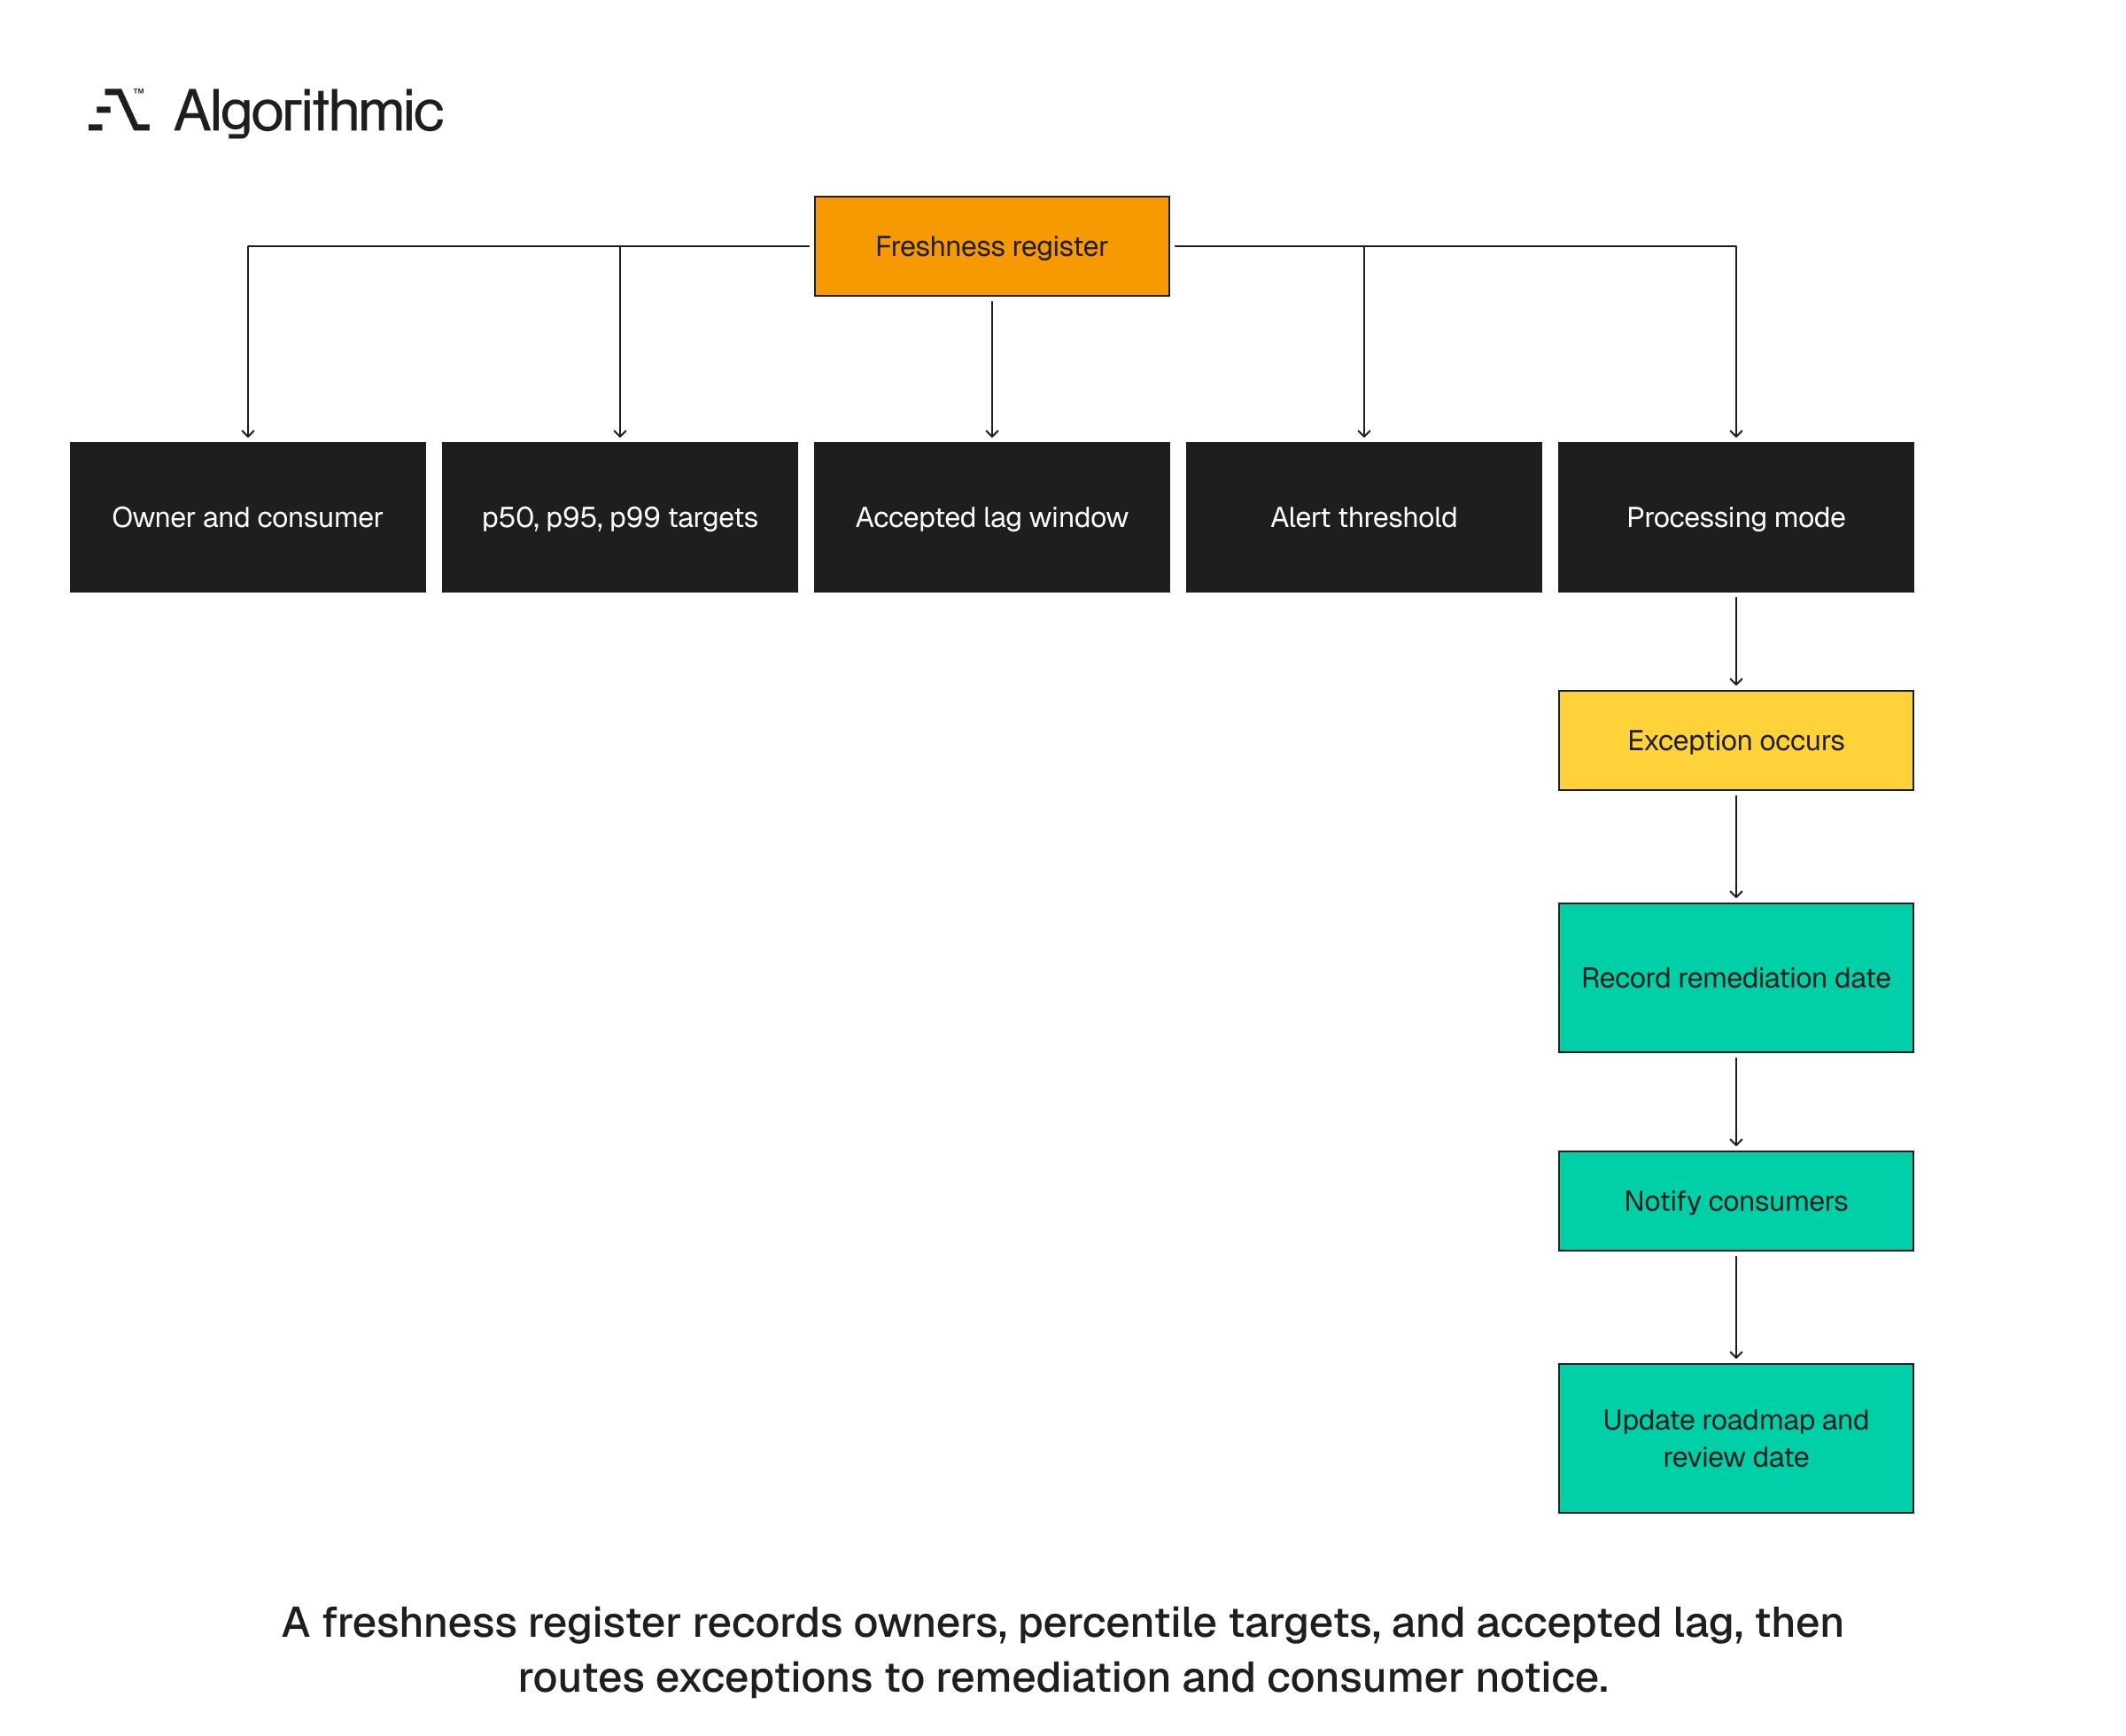
Streaming, micro-batch, and batch are processing patterns with different cost, correctness, and operating profiles, and the right choice follows the freshness SLO for each decision. A data platform should include an explicit freshness register, one row per critical table, feature, dashboard, or operational workflow, where each row names the owner, consumer, p50 target, p95 target, p99 target, time basis, accepted lag window, alert threshold, and processing mode. Create that register before selecting Kafka, CDC tooling, orchestration, warehouse tasks, or batch ETL, then update the data platform roadmap so each pipeline is engineered to its measured freshness requirement. The result is a platform that spends engineering effort where freshness changes the business decision and leaves slower workloads on simpler, cheaper, more auditable paths.
The register should capture exceptions, since some datasets will exceed their SLO during source outages, vendor throttling, or scheduled maintenance. Those exceptions need an owner, a remediation date, and a communication plan for consumers that states whether dashboards freeze, show provisional numbers, or hide affected metrics.
 Click to expand
An auditable decision record protects the platform team. When a stakeholder asks for “real time”, the team can point to the decision, the freshness target, the cost model, and the processing choice. That record turns architecture debate into a business conversation, and it creates a common language for engineering, finance, risk, product, and executive users.
Freshness is the governing metric for processing architecture, so define it at the decision level, measure it end to end, and select the least complex system that meets the SLO with the required correctness. Streaming then serves the workloads that need it, micro-batch covers minute-level operations, and batch remains the right architecture for most hourly and daily reporting. The final test is operational evidence, since a system that meets its freshness SLO, passes correctness checks, and fits the team’s operating model is sound. If the system misses its SLO, fix the measured delay stage, and if it exceeds the SLO at excessive cost, simplify the processing path. That discipline keeps data platforms from drifting into unnecessary complexity, and it gives leaders a defensible reason for every Kafka topic, warehouse task, feature table, and scheduled job.
Algorithmic builds data infrastructure and integrations engineered to the freshness each decision actually needs, from sub-second fraud paths to certified daily reporting. Start a conversation if your platform is running streaming where a batch job would do, or missing decisions where the tail latency hides.