

One dashboard read 87% complete while production still carried 46 open defects. That was a $2.4 million SaaS build with one deployment in six weeks, thirty-one percent of closed defects reopened, and no reliable release path. The status report showed progress, and the delivery system showed failure.
A software project rescue starts by separating narrative from operating facts. Teams under pressure curate status, vendors defend their position, and product owners reinterpret scope. Executives ask whether the plan remains on track, and the answers arrive through documents already filtered by the delivery chain.
A credible rescue begins with two weeks of forensic measurement. The work establishes what the delivery system produces before leaders change the roadmap, replace people, or approve more budget, and without that baseline leadership funds the intervention easiest to explain. The measurement period also changes the executive conversation, moving it from sentiment to evidence in deployment logs, defect history, pull request cycle time, incident records, and scope movement. That evidence gives leadership a defensible basis for continuing, resetting, or stopping the project.
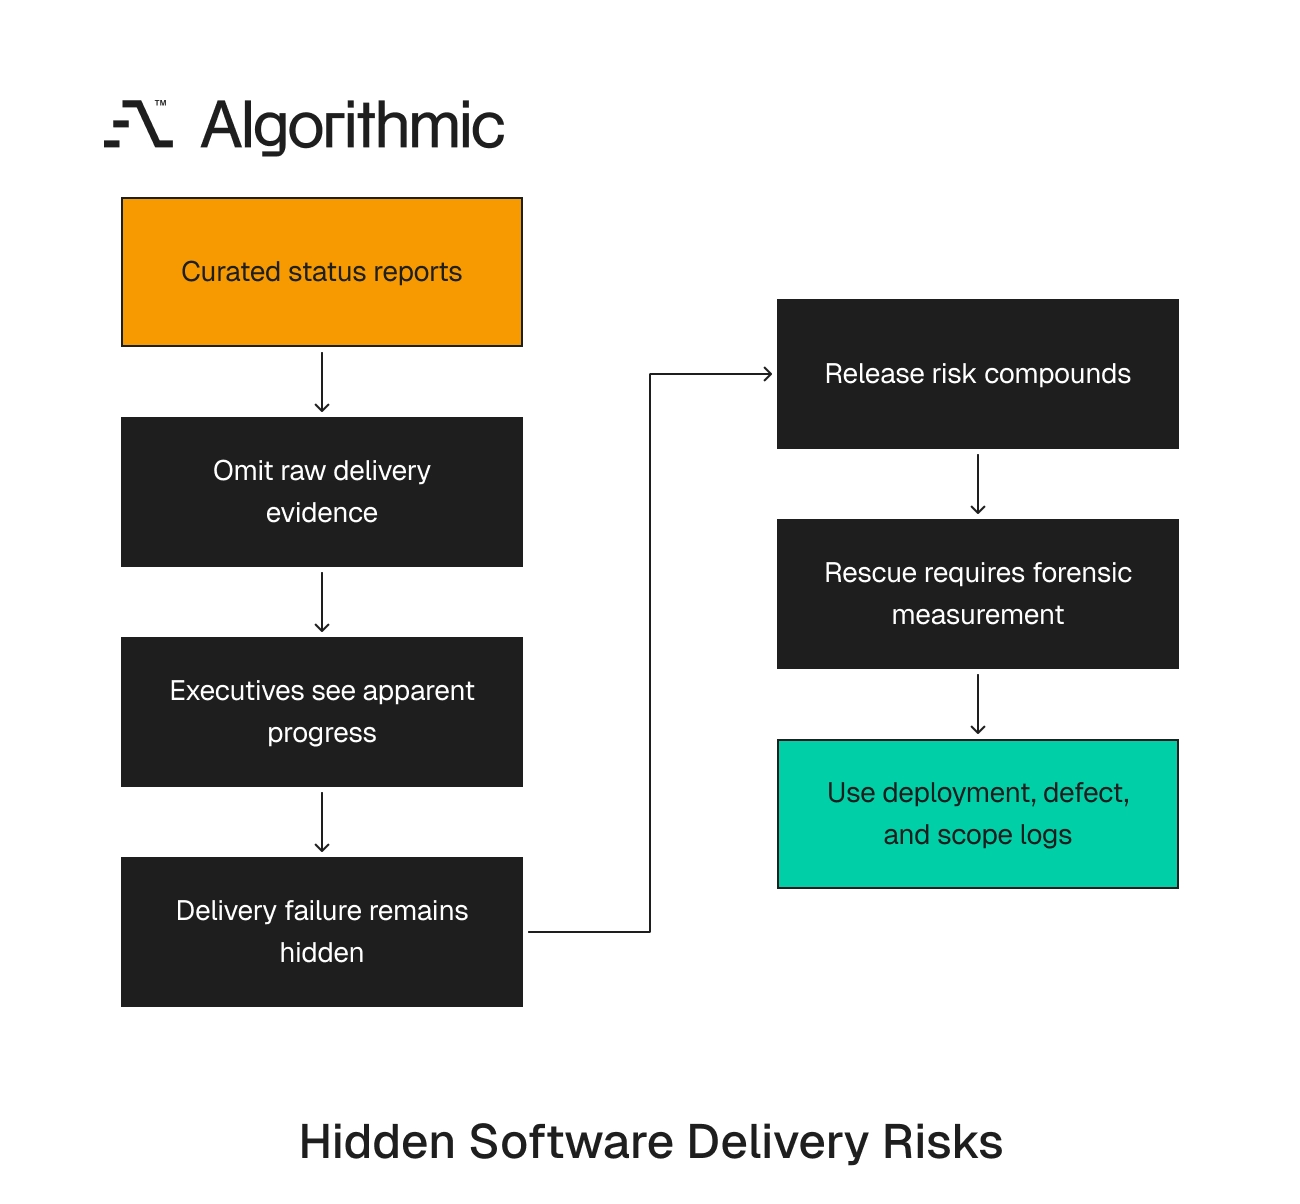
Curated status reports conceal delivery failure
Most project reporting centers on planned work, meaning task completion, milestone percentage, sprint velocity, budget consumed, and forecast launch date. These measures have a place in routine governance, but they fail in distressed delivery. Task completion is the weakest, since a Jira ticket can close while the code remains unmerged, untested, undeployed, or later reopened, and a feature can be marked complete while support teams document defects against the same workflow.
A vendor can report 40 finished tickets in a sprint while the release branch never reaches staging. A product owner can accept a workflow in a demo while the same workflow fails under production data, and a project manager can show a green milestone while release engineering carries three unresolved blockers.
Rescue assessments should start with raw delivery signals, meaning recorded events produced by the delivery system, including commits, pull requests, deployments, failed builds, defect reopenings, incident timestamps, rollback events, and scope changes. These records are harder to curate after the fact because they sit in systems with timestamps, owners, and durable histories. External checklists help leadership spot warning signs like late milestones, budget overrun, stakeholder fatigue, and low confidence, and the next step is measurement discipline, where leaders read evidence from systems of record instead of confidence ratings from the delivery chain under review.
Curated reports often fail through omission. A weekly steering deck can show 18 completed stories and omit that 11 are waiting for acceptance, and a burndown chart can look healthy while the team moves defects into a separate backlog. A budget summary can show spend on plan while the release path has not worked for a month, a QA report can show a falling defect count after the team changes severity labels, and a vendor report can show higher velocity after the team splits one workflow into six tickets. Status reports are testimony, and delivery logs are evidence.
 Click to expand
 Testimony gives context, and evidence shows what the delivery system produced, when it produced it, and what failed afterward. A rescue leader needs both, in that order. The same discipline applies to executive summaries, where a one-page update can state that the team “completed checkout”, while Git history shows the payment authorization change missed the release branch. Support logs can show that six customers still cannot complete checkout with saved cards, and incident records can show a rollback four hours after deployment. Those records define the operating facts.
The first two weeks should measure before changing the plan
A software project rescue should start with a forensic baseline. A roadmap workshop can wait until leadership knows how the delivery system performs, since replanning without measurement converts uncertainty into another slide deck. Two weeks is enough to inspect the current delivery system without freezing the team, covering the previous 8 to 12 weeks of activity across source control, CI/CD, ticketing, incident management, test systems, and product scope records. The review should also observe the current working cadence in planning, code review, release preparation, defect triage, and acceptance testing.
Across 35-plus complex engagements, we have seen the same pattern, where leaders reset projects before they measure delivery mechanics and the revised plan inherits the old failure mode. A new deadline lands on an unchanged system. The next steering meeting receives a cleaner plan with the same production risk, the board hears a new launch date, and the engineering team continues through the same blocked release branch, unstable acceptance process, or repeated defect class.
The baseline has four outputs:
- A quantified view of delivery throughput.
- A quantified view of quality and rework.
- A map of scope movement and decision latency.
- A diagnosis of the primary failure mode.
This sequence prevents premature action, because a scope problem requires one treatment and an architecture problem requires another. Vendor underperformance requires different action from unclear acceptance criteria, a release safety problem requires different funding from a product governance problem, and a team skill problem requires different leadership than a procurement delay. A team that cannot deploy safely needs release repair before it needs more user stories, a team blocked by product sign-off needs decision rules before it needs a second development squad, and a team producing repeated payment defects needs senior engineering review before it needs a launch announcement.
The two-week period also protects the team from random executive intervention. Without a baseline, each stakeholder brings a preferred remedy of more developers, fewer features, a new vendor, a new date, or a new product owner, and measurement ranks those choices against the constraint visible in the delivery system. The assessment should run while normal delivery continues, so the rescue team observes the system under operating load. Pausing all work creates a false picture and hides the queues leadership needs to see.
Timing matters, because a distressed project changes behavior when leaders announce a rescue, and teams close old tickets, rewrite statuses, and prepare explanations. A live measurement period reduces that distortion, since the records already exist before the assessment starts. The review team reads the history, then watches whether current behavior matches it.
A concrete rescue baseline in practice
One B2B SaaS company entered rescue after missing three customer launch dates. The internal report showed 82% of features complete and 94% of planned sprint work closed, and the company had spent $1.8 million across internal staff, a vendor team, and cloud environments. The raw baseline told a different story. Production deployment frequency had fallen from every Thursday to once every 29 days, median pull request cycle time had reached 4.6 business days, and 22% of pull requests waited more than 10 business days. The team had reopened 28% of closed tickets during the prior 10 weeks, and four modules produced 63% of reopened defects.
Median product acceptance latency was 6.8 business days, enterprise SSO changes waited an average of 11 business days for test accounts, and support logs showed six customer-facing onboarding defects tied to the same identity provider workflow. The first executive request was to add four contract developers, but the baseline showed that more developers would have increased queue depth in review and acceptance, so the funded intervention changed.
One senior engineer owned the four hotspot modules, release engineering rebuilt the deployment runbook, and the product lead froze net-new scope for 10 business days. The CTO named one product owner with approval authority and a two-business-day service level for acceptance decisions, and any missed decision moved to the CTO’s daily review. After 30 days, the team returned to weekly production deployments, reopened work fell below 15% of closed tickets, and acceptance latency fell to 2.9 business days.
The project recovered through funding the measured constraint. Morale work, new rituals, and a larger team were secondary, and the constraint-based intervention saved one quarter of payroll and preserved the first customer cohort. The intervention also changed vendor management, since the vendor stopped receiving credit for closed tickets until release evidence existed, and payment milestones moved from sprint completion to accepted production deployment. That contract change reduced argument, because the vendor, product owner, and CTO worked from the same source-linked evidence, and the recovery plan became operational, measurable, and enforceable.
The raw signals that matter in a rescue
The strongest rescue metrics come from event logs, pulled directly from GitHub, GitLab, Bitbucket, Jira, Linear, Azure DevOps, CircleCI, Buildkite, Datadog, Sentry, PagerDuty, and cloud audit logs. The team should export raw records before reconciling labels, statuses, or report names. Four of these signals map directly to the DORA metrics that research links to software delivery performance, and the same four keys of deployment frequency, lead time, change failure rate, and time to restore give the baseline an evidence base leadership can defend. The following table is the minimum measurement set for a two-week rescue assessment.
| Signal | Primary source | What it reveals | Distress threshold to investigate |
|---|---|---|---|
| Deployment frequency | CI/CD and release logs | Whether completed work reaches users | Fewer than 1 production deployment every 2 weeks for an active product team |
| Lead time for change | Git and CI/CD | Time from first commit to production | Median above 10 business days on routine changes |
| Pull request cycle time | GitHub, GitLab, Bitbucket | Review speed and work size | Median above 3 business days |
| Rework percentage | Ticket history and PR links | Amount of work redone after closure | Above 20% reopened or materially revised work |
| Defect escape rate | QA and production defect logs | Quality of pre-release testing | Rising production defects after each release |
| Change failure rate | Incident and deployment logs | Release safety | More than 15% of releases causing rollback, hotfix, or incident |
| MTTR | PagerDuty, Opsgenie, incident records | Recovery discipline | Median above 4 hours for severity 1 or 2 incidents |
| Build failure rate | CI logs | Codebase health and test reliability | More than 25% failed default-branch builds |
| Scope churn | Backlog history and change requests | Product decision stability | More than 15% of sprint scope added or removed mid-cycle |
| Acceptance latency | Ticket workflow timestamps | Product and stakeholder response time | Median above 5 business days |
These thresholds trigger investigation rather than universal targets, since a payments platform, a regulated healthcare workflow, and a consumer marketplace have different release profiles, approval paths, and risk tolerances. Read the pattern before interpreting a single number, because rising pull request cycle time, declining deployment frequency, and growing work in progress indicate delivery drag before deadline slip appears in the plan. Workflow indicators often show risk 2 to 4 weeks before project management tools reflect it.
Raw signals need careful interpretation. A low deployment count during a planned security freeze has one meaning and the same count during normal feature development has another. A high build failure rate during a planned migration needs one response while failed default-branch builds during routine development need another, and a long lead time caused by external certification differs from a long lead time caused by internal review queues.
The source system tells the team where to inspect. Git shows review delay and change size, CI/CD shows release friction and build reliability, and ticket history shows rework, scope churn, and acceptance latency. Incident systems show release safety and recovery discipline, and cloud audit logs show environment changes that never appear in the project plan.
The measurement team should preserve context without softening the evidence, so every metric needs a source, date range, calculation rule, and exception note. That discipline prevents the rescue from becoming an argument over definitions. A useful rule is direct, since no metric enters the executive memo without a source link that points to a deployment record, pull request, ticket history, incident record, or analytics event, and a number without a source becomes another status claim. The team should also keep raw exports, because Jira fields change, labels get renamed, and vendors clean up statuses during a rescue, and a dated export preserves the record used for executive decisions.
Defects and rework reveal the economics of delay
Rework is one of the clearest signals in a rescue. A team that closes 80 tickets and reopens 24 has not completed 80 units of work, it has created a second queue that competes with new development. Executives should ask for a rework ledger rather than a defect summary, showing the original ticket, the closure date, the reopening date, the cause, the owner, and the time spent on correction, which separates unclear requirements from engineering defects and integration failures. A typical pattern looks like this:
- 12 reopened defects tied to unclear acceptance criteria.
- 9 defects tied to incomplete regression coverage.
- 7 defects tied to inconsistent API behavior between staging and production.
- 4 defects tied to third-party integration changes.
Those four causes require four different actions. More developers will not correct acceptance ambiguity, and more product meetings will not repair missing regression tests. A vendor escalation will not stabilize third-party contracts without test doubles and versioned API assumptions, a release manager will not repair a defect pattern caused by unsafe retry logic, and a QA push will not repair product decisions that change twice per week.
This is where rescue economics become visible. If a six-person team spends 35% of its capacity on rework, more than two full-time people are funding past defects each week, and at a blended loaded cost of $180,000 per engineer per year that equals more than $30,000 per month in rework burn before opportunity cost is counted. Rework also damages sequencing, because product managers plan future releases against completed work and then discover that closed tickets require correction before the next dependency can start. The roadmap slips through rework queues that never appeared in the original plan, customer commitments fail because hidden defect work consumes the team’s release capacity, and finance sees the cost after the delivery system has spent it.
A useful rework ledger classifies each item into one of six categories, being requirement ambiguity, code defect, test gap, environment mismatch, integration failure, or operational error. That classification gives leadership a clean view of the failure source and prevents teams from treating every reopened ticket as the same defect type. The ledger should include severity and business exposure, since a reopened admin-label ticket does not carry the same cost as a reopened onboarding defect blocking 22% of new accounts, and this distinction matters when leadership decides which defects receive senior attention. The ledger should also track repeat ownership, so if one module produces repeated defects across several developers, inspect the design, and if one squad produces repeat defects across several modules, inspect supervision and review standards.
A high rework rate also affects morale and retention, because engineers lose confidence when completed work returns every week and senior practitioners start spending their time on cleanup instead of architecture, mentoring, or release safety. This cost appears late in financial reporting, where payroll stays constant while delivery output falls, and the rework ledger shows that decline before the next budget review.
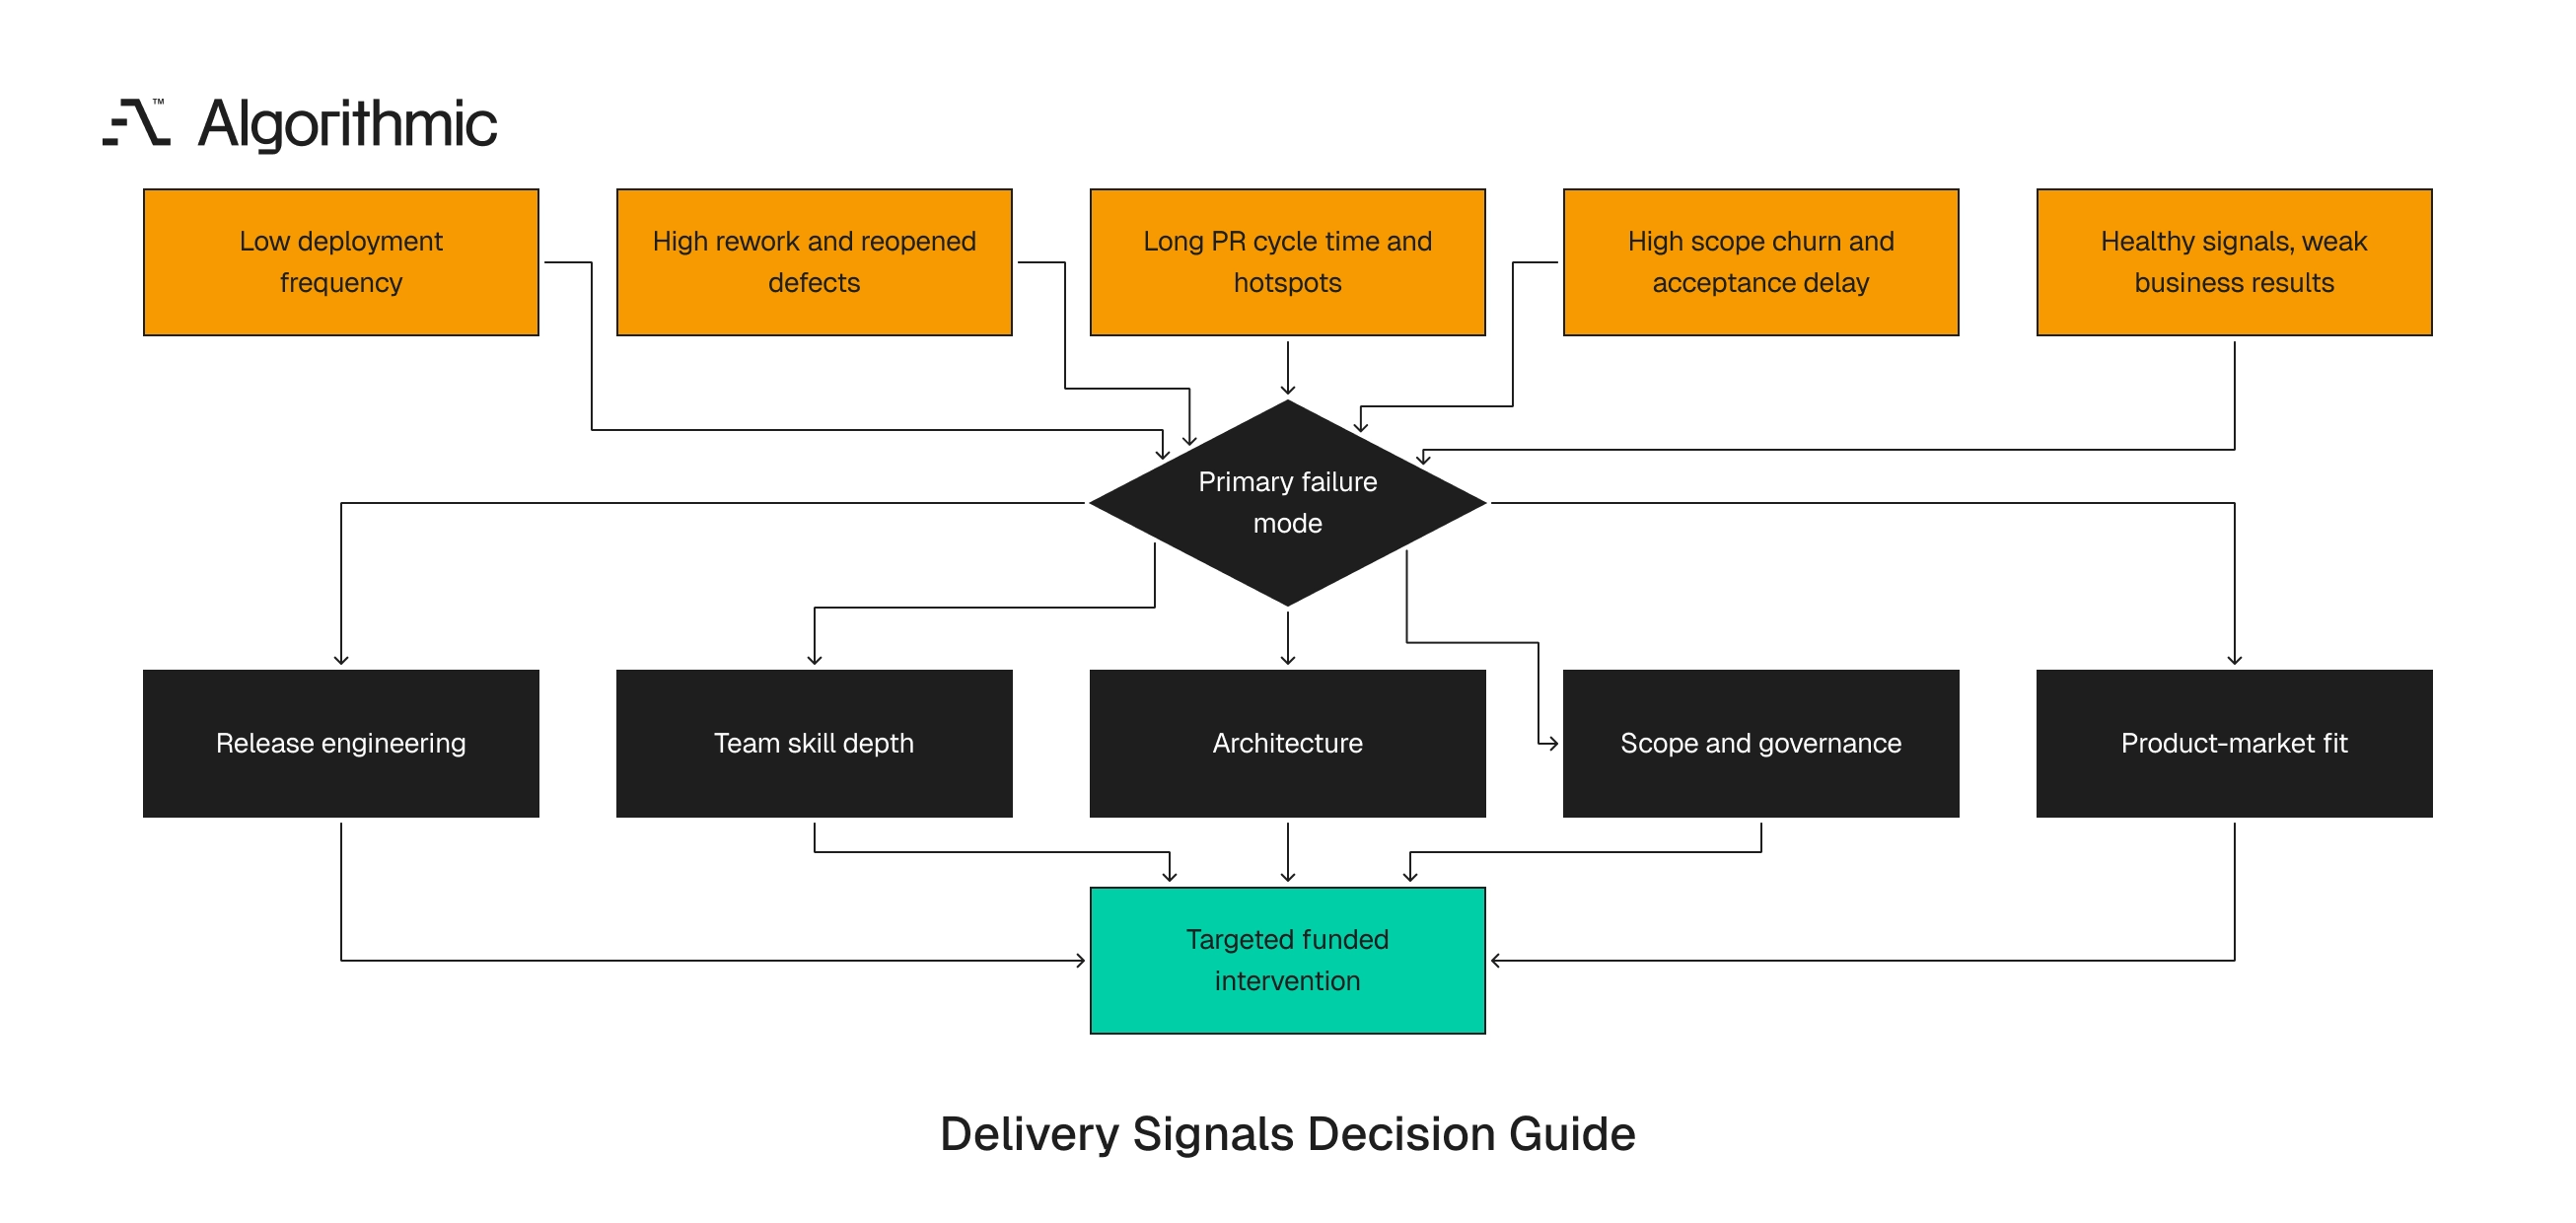
Delivery signals identify the primary failure mode
A distressed project often has more than one problem, but the rescue plan should still name the dominant failure mode, because without that diagnosis leadership spreads effort across too many interventions and loses another quarter. The failure mode should be expressed as an operating constraint rather than a general complaint. “The vendor is underperforming” is too broad, while “thirty-one percent of closed tickets reopened, with 70% tied to the same three modules” gives leadership a basis for action.
A strong diagnosis also names what leadership should stop funding, since if the constraint is acceptance latency then more developers add inventory to a blocked queue, and if the constraint is release safety then feature expansion increases deployment risk. The diagnosis should fit into one sentence like “the project is constrained by release safety, shown by four hotfixes in nine releases and a median MTTR above six hours”, which gives executives a target for funding. A weak diagnosis describes discomfort, so “the team needs better alignment” gives no budget decision while “product acceptance takes 7.4 business days at median and blocks 19 tickets” gives leadership a specific intervention.
Scope failure shows up as churn and acceptance delay
Scope failure is visible in backlog movement, so watch mid-sprint additions, late requirement rewrites, unresolved acceptance criteria, and stakeholder review queues, since these signals show that the team is building against unstable demand. A project with 25% mid-sprint scope churn should pause roadmap expansion, and the correct intervention is tighter decision governance with a named product owner, weekly scope control, written acceptance criteria, and a change log with cost and date effect. The team also needs a shared definition of completion that includes acceptance, test evidence, and release readiness.
The business decision is direct. Freeze net-new scope for 10 business days, classify open work into revenue-critical, compliance-critical, retention-critical, and deferrable categories, then rebuild the release plan around the first three categories. This gives executives a working plan tied to financial exposure and stops low-value additions from consuming recovery capacity. Scope control should include a visible trade-off log, so if leadership adds a new enterprise reporting feature during a rescue period, the log should identify the feature removed, the owner approving the change, and the date effect, which prevents silent expansion from consuming the recovery plan.
Acceptance criteria need the same discipline, so every priority workflow should state user role, starting condition, success condition, failure condition, data assumptions, and evidence required for acceptance, and a ticket without those fields should stay out of the rescue release. The acceptance standard should be short and testable, for example “an enterprise admin can invite 50 users from a CSV file, receive error rows, and see successful users provisioned within five minutes”, which gives engineering, QA, and product the same target. Scope control also requires authority, because a product owner without decision rights becomes a message router, and a rescue period needs one accountable person who can approve, reject, or defer work.
Architecture failure shows up as cycle time and change coupling
Architecture failure is visible when small changes take too long. A single copy change requiring three repositories, two database migrations, and manual QA across five flows indicates excessive coupling, and the signal is lead time rather than opinion. Inspect pull requests that exceeded the 90th percentile for cycle time, since if the same modules appear repeatedly the architecture has a concentration risk, and if every change requires broad regression testing the system lacks isolation boundaries.
The intervention is targeted technical repair, which can include API contract tests, modular boundaries, database migration discipline, or infrastructure as code, and the work needs a measured cost case, a bounded scope, and a connection to release recovery. Architecture rescue should avoid the language of total rewrite unless the numbers support it, since a rewrite decision needs evidence such as repeated production defects in core modules, unsustainable change coupling, unsupported frameworks, or security defects that cannot be patched safely. Most distressed projects need repair at specific seams. A seam-level repair can isolate billing calculations behind a versioned service contract, add contract tests between the SaaS application and Salesforce, and separate background job retries from payment authorization to prevent duplicate charges.
These repairs have narrow scope and measurable effect, so leadership should expect lower cycle time in hotspot modules, fewer regression failures, and safer releases, and if those signals do not move within 30 days the repair plan lacks force. Architecture findings should include examples from the codebase, so “OrderService imports 17 modules and writes to 6 tables during checkout” is stronger than “checkout is complex”, and “every entitlement change requires full regression across billing, provisioning, and notifications” gives leadership the cost of coupling. The assessment should also identify deferred technical decisions that now affect delivery, such as missing migration rollback scripts, shared database tables across services, and absent contract tests for partner APIs, since these defects become business problems when launches depend on them.
Team skill depth shows up as review loops and defect classes
Skill depth failure is visible in repeated review comments, avoidable defects, and unstable builds, with examples like unparameterized SQL, missing idempotency in payment flows, unsafe background job retries, and absent input validation. These defects appear in code review and then appear again in production when reviewers lack time or authority. This diagnosis requires direct code inspection, because metrics show where to inspect while senior engineers must read the code, so a rescue team should sample 20 to 30 pull requests across critical modules and classify defects by severity and recurrence. If the same design errors recur across developers, the project needs senior engineering direction, if errors concentrate around one vendor squad, leadership needs a vendor performance action, and if the code is sound and delays sit in acceptance, engineering skill depth is not the primary constraint.
The review should examine test design, error handling, data migration safety, authentication boundaries, observability, and deployment assumptions, since a shallow scan of code style will not diagnose rescue risk, and senior reviewers need to trace how changes move from code to production and where defects escape. A useful review pattern is to follow one high-value workflow end to end, so for a subscription product, trace account creation, plan selection, payment authorization, provisioning, email confirmation, and entitlement checks, then review the tests, logs, rollback path, and defect history for that path. This inspection exposes skill gaps that metrics alone cannot explain, showing whether engineers handle edge cases, data consistency, retries, timeouts, and partial failure, and whether senior reviewers enforce standards or approve risky code under schedule pressure.
Skill depth findings should produce clear actions, which can include assigning a senior technical lead, pairing engineers on hotspot modules, tightening review gates, or replacing a vendor squad, since training without code ownership rarely changes a distressed project within 30 days. The review standard should be explicit, so a pull request touching payments, authentication, authorization, or data migration needs senior approval and test evidence, and a rescue project cannot treat all code paths as equal risk.
Governance failure shows up as decision latency
Governance failure is measured in waiting time. Long queues for security review, product sign-off, legal approval, data access, and environment provisioning create delivery drag that teams often mislabel as engineering delay, and the project plan then blames the wrong function. Workflow timestamps show this clearly, since a feature can spend 2 days in development, 1 day in review, 9 days waiting for acceptance, and 6 days waiting for a test account from an enterprise partner, and calling that an engineering delay leads to the wrong escalation.
The intervention is decision architecture. Name approvers, set service levels for reviews, remove committees from routine decisions, reserve steering group time for changes that alter cost, date, risk, or scope, and push routine acceptance to the accountable product owner. Governance repair should produce a decision register listing open decisions, accountable owners, due dates, blocked work, and financial exposure, since a stalled security review tied to a $600,000 customer renewal deserves a different escalation path from a low-risk interface color decision.
Decision latency also has a human cost, because engineers lose context when work waits for approval across multiple days, and rework rises when they return to half-finished code after product direction changes. The decision register should be reviewed daily during the rescue period, where each blocked item needs a named owner and a next action, and any decision older than its service level should move to the executive sponsor. Governance metrics should appear beside engineering metrics in the rescue memo, since acceptance latency, security review latency, and data access latency often explain delivery drag, and without those numbers executives keep pressing the wrong team.
The rescue decision matrix
Leadership needs a decision structure that connects evidence to action. The following matrix is a practical starting point, where each row links an evidence pattern to the initial funded intervention and the 30-day test.
| Evidence pattern | Primary failure mode indicated | Initial funded intervention | Decision after 30 days |
|---|---|---|---|
| High scope churn, long acceptance latency, stable code quality | Scope and governance | Freeze scope, assign single product owner, define acceptance rules | Continue if churn falls below 10% and acceptance median falls below 3 days |
| Low deployment frequency, high change failure rate, high MTTR | Release engineering | Stabilize CI/CD, add release runbook, add rollback path, monitor incidents | Continue if weekly deployments resume and severity incidents decline |
| High rework, repeated defect classes, poor PR quality | Team skill depth or vendor underperformance | Add senior technical lead, inspect PRs, set quality gates | Replace team or vendor if repeat defects remain above 20% |
| Long PR cycle time, broad regression effect, repeated module hotspots | Architecture | Repair specific seams, add contract tests, reduce change coupling | Continue if lead time drops by 30% in hotspot modules |
| Healthy engineering signals, persistent business dissatisfaction | Product-market or requirements fit | Reassess product scope, user workflows, and commercial goals | Reset roadmap or stop project |
The matrix prevents rescue theater, since each intervention has a measurable test, and if the signal does not move the intervention is failing.
 Click to expand
 The 30-day decision point matters because rescue work can become indefinite, where teams start a stabilization effort, add more meetings, produce more reports, and ask for patience, so leadership should grant time only when the measured constraint moves. A 30-day test should include one primary signal and two guardrail signals. For release engineering, the primary signal can be weekly production deployment with guardrails for change failure rate and severity incident count. For scope repair, the primary signal can be sprint scope churn with guardrails for acceptance latency and reopened work tied to unclear requirements, and for architecture repair, the primary signal can be lead time in hotspot modules with guardrails for escaped defects and build failure rate.
This structure keeps the rescue honest, because teams cannot declare progress through activity and must show movement in the operating constraint. The matrix also supports hard stop decisions, so if repeat defects stay above 20% after senior review gates, leadership should replace the team or vendor, and if weekly deployment remains impossible after release repair, the CTO should reset the launch plan. A stop decision is a management action rather than a failure of resolve, since continuing an unchanged delivery model after the signals fail consumes capital without increasing certainty, and executives should treat the 30-day test as a funding gate.
AI acceleration makes raw signals more important
AI-assisted development has increased code production across many teams. CircleCI’s 2026 State of Software Delivery report analyzed nearly 28 million CI workflows across more than 22,000 organizations and found the largest rise in development activity since 2019, yet the majority of that activity never reached production. More code movement does not prove better delivery, and in distressed projects AI tools can increase the volume of pull requests, tests, and generated scaffolding while cycle time, defect escape rate, and deployment frequency deteriorate. The signal to watch is validated change reaching production safely, since code volume, commit volume, and generated test count do not show delivery health on their own.
Teams using AI agents should add three measurements to the rescue baseline:
- Percentage of AI-generated code changed during review.
- Defects traced to generated code or generated tests.
- Validation time per AI-assisted pull request.
A healthy AI-assisted workflow reduces cycle time without increasing escaped defects, while an unhealthy workflow shifts effort from writing code to reviewing, correcting, and stabilizing generated output, which creates the appearance of speed while senior engineers absorb more review burden. This distinction matters for budget, because hiring more developers or adding coding agents will not rescue a project constrained by review capacity, weak test design, or unstable requirements, and in those conditions more code enters the queue faster than the system can verify it.
AI-assisted delivery also requires traceability, so pull requests should identify generated code when the tool materially shaped the implementation, and test failures, review changes, and production defects should retain that link so the team can measure quality by source. The rescue team should inspect AI-assisted pull requests for repeat patterns like incorrect library use, shallow tests that mirror implementation, missing authorization checks, and overbroad exception handling, since these defects raise review load and create a false sense of completion. The executive question is direct, asking whether AI reduced verified lead time to production or moved work into review and defect correction, and the raw delivery signals answer that question where tool adoption data alone does not.
AI findings should appear in the same ledger as other delivery findings, so an AI-generated test that asserts mocked behavior without validating business rules belongs in the test-gap category, and an AI-generated service call without authorization checks belongs in the security defect category. This prevents tool debates from replacing delivery evidence, since the tool is less important than the measured effect on throughput, quality, and review load, and leadership should fund AI use only when verified lead time improves and escaped defects stay controlled. A practical review sample is 25 AI-assisted pull requests across high-risk modules, tracking how much code reviewers changed, how many test failures occurred, and whether production defects followed, which gives executives a grounded view of AI’s effect on delivery.
Raw business signals belong beside engineering metrics
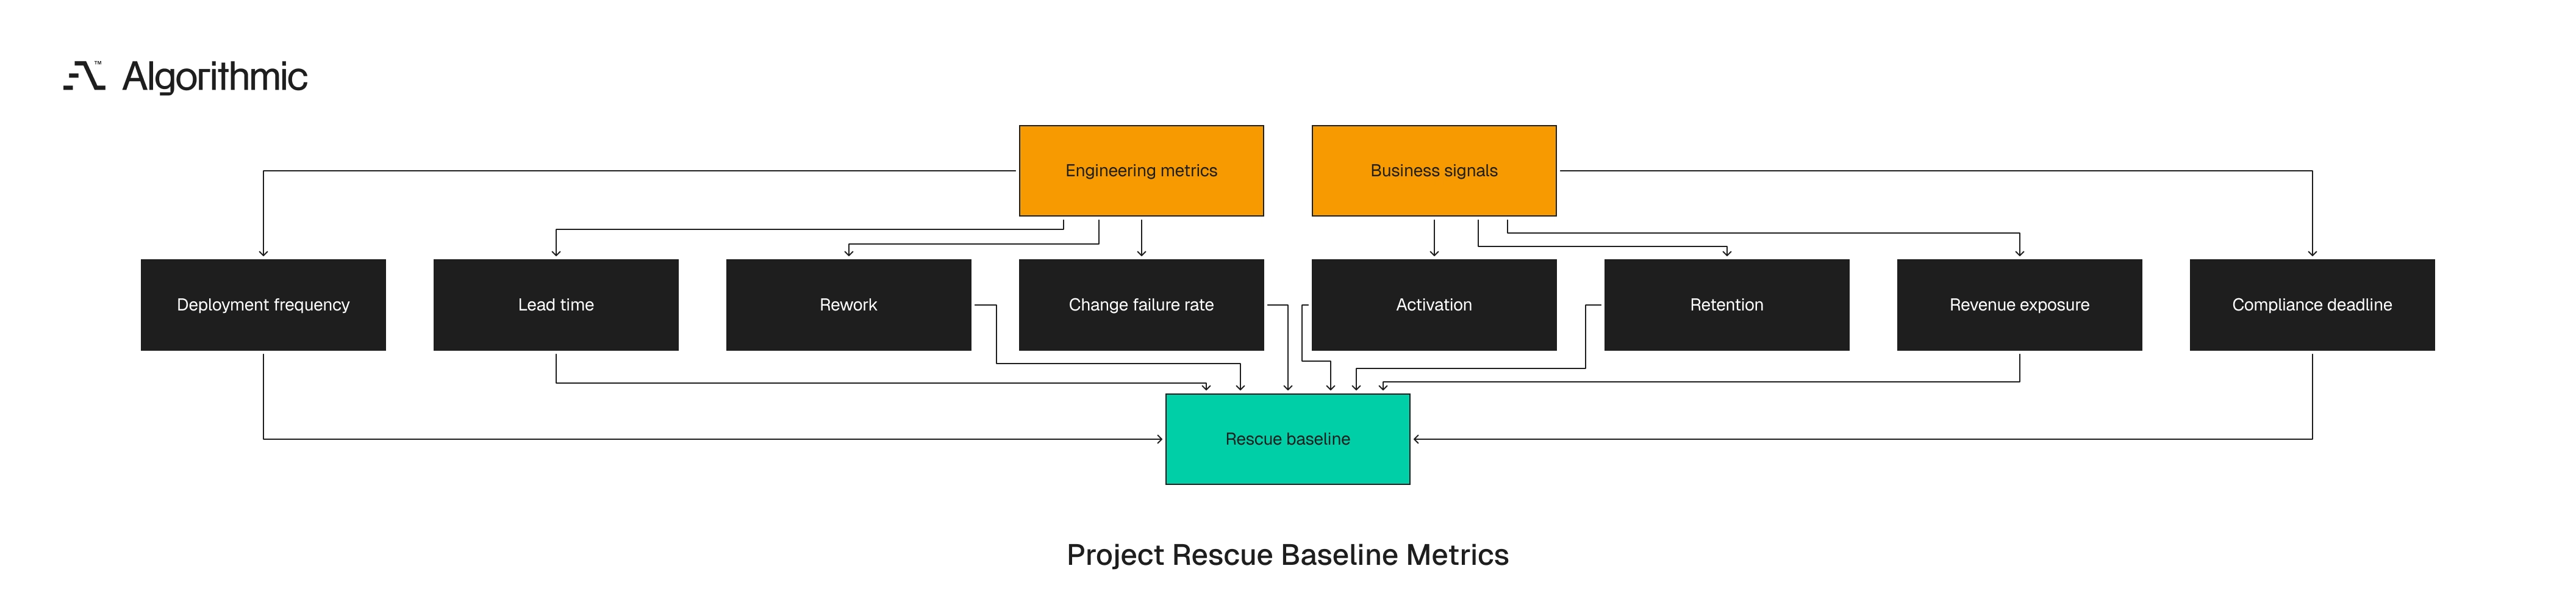
Software project rescue should connect delivery facts to business outcomes, because engineering metrics alone can create a technically tidy plan that does not protect revenue, retention, or regulatory deadlines, and a release pipeline can improve while the product continues to miss the commercial need. For a SaaS product development effort, the rescue baseline should include activation, conversion, retention, support contacts, and revenue exposure for affected workflows. For an internal operational analytics platform, it should include report adoption, manual workaround hours, data freshness, and decision cycle time, and for a regulated workflow, it should include audit defects, exception volume, approval latency, and control failures.
Treat key product stages like service level objectives, defining a target, tracking the trend, and triggering investigation when the stage degrades, so a checkout completion drop from 68% to 54% after a release should trigger a defect and data review before a pricing discussion. This helps distinguish user behavior from delivery failure, since a conversion drop can come from a frontend regression, a data pipeline error, a payment provider issue, or a demand shift, and raw telemetry separates these causes. Business metrics also help rank technical work, because a defect in a low-use admin screen has a different value from a defect blocking onboarding for 22% of new accounts, and the rescue plan should tie engineering intervention to revenue, retention, compliance, or operating cost. The best rescue baselines connect one engineering signal to one business exposure, so deployment frequency matters because delayed entitlement fixes affect new customer activation, and rework matters because defect correction consumes the capacity needed for a contractual launch.
 Click to expand
 This connection changes board behavior, since a board can debate whether a team “needs more time”, but it cannot ignore a release blocker tied to $1.2 million in renewal exposure. Business exposure should be quantified with the same rigor as engineering signals, naming the affected customer cohort, contract value, renewal date, support volume, or compliance deadline, because a vague “customer impact” statement does not support a funding decision. For example, “SSO defects block 14 enterprise accounts worth $2.8 million in annual recurring revenue” changes prioritization while “onboarding has defects” does not, and the first statement gives leadership a clear basis for intervention. Raw business signals also prevent overcorrection, because a project can have serious engineering debt in a low-value workflow, and during a rescue leadership should fund work tied to measurable exposure before lower-risk cleanup.
How to run the forensic measurement period
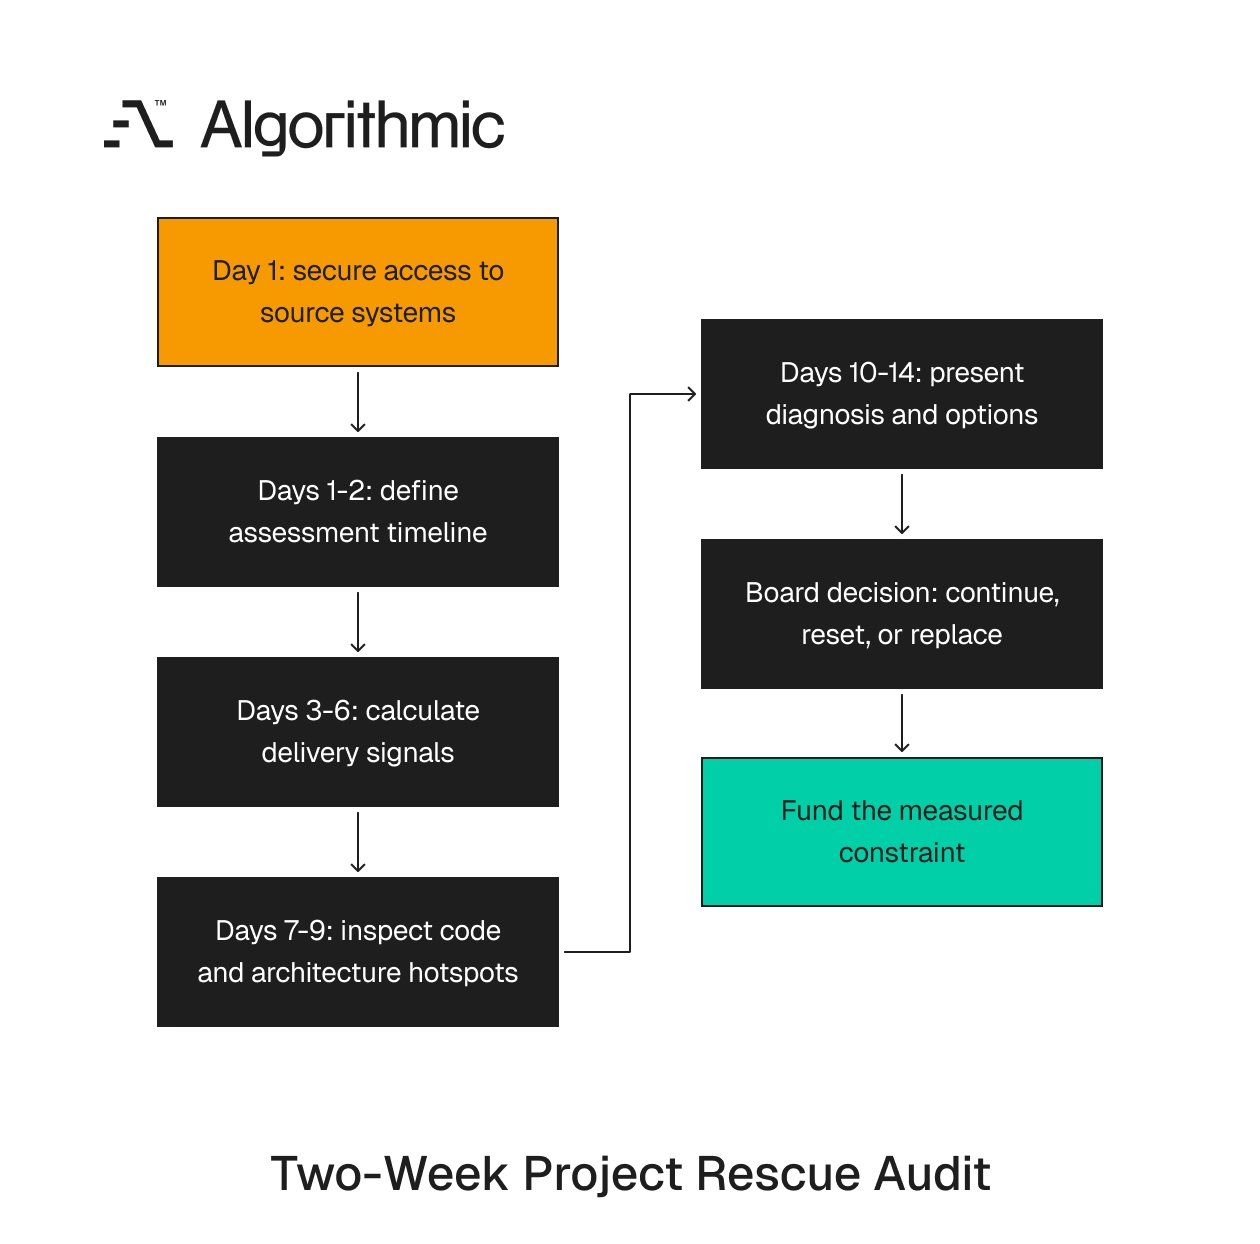
The two-week assessment needs authority, access, and restraint. The team conducting the review should have read access to source control, CI/CD, cloud logs, ticketing, incident tools, analytics, and release notes, and permission to interview engineers, QA, product owners, support staff, and vendor leads. Do not ask the delivery team to prepare a special rescue report, but pull the records directly and ask the team to explain anomalies after the data is assembled. The assessment lead should publish one rule on day one, that records outrank narrative, which reduces defensiveness, focuses the review on the operating system, and protects engineers from being blamed for delays caused by governance, scope churn, or missing environments. A practical two-week cadence works as follows.
 Click to expand
 Days 1 to 2 secure records and define the timeline
Collect access to Git, CI/CD, ticketing, incident systems, test management, analytics, cloud logs, and scope documents, define the assessment window of the prior 8 to 12 weeks, and confirm the system names, workflow statuses, release branches, and production environments before calculating metrics. Create a single timeline of releases, incidents, major scope changes, vendor escalations, and executive steering decisions, with dates, owners, affected systems, and source links, which becomes the shared reference point for the rest of the assessment.
This phase should also identify missing records, so if release notes are absent, incident records are incomplete, or ticket statuses lack timestamps, record the gap as part of the diagnosis, since missing evidence is an operating risk. Access gaps should receive named owners and deadlines, because a rescue cannot wait 10 days for basic Jira export access or cloud audit logs, and if a vendor controls the systems of record, the contract should require data delivery within 24 hours. The timeline should distinguish planned events from unplanned events, since a scheduled maintenance window and an emergency rollback carry different meanings, and the same calendar view should show both with sources attached.
Days 3 to 6 build the delivery signal baseline
Calculate deployment frequency, lead time, PR cycle time, rework percentage, defect escape rate, change failure rate, MTTR, and scope churn from raw events, then reconcile labels and statuses, and keep calculation rules visible so leadership can test the numbers. Flag inconsistencies like tickets closed after branch merge with no deployment, defects marked fixed without test evidence, and releases missing rollback notes, since these often reveal governance failures before interviews begin. The baseline should separate averages from medians and outliers, because a mean lead time of 8 days can hide a median of 3 days and a cluster of 40-day enterprise integration items, and rescue decisions require distribution rather than one summary number.
The team should also segment the data by module, squad, vendor, and work type, since defect rates for payment flows matter more than defect rates for internal copy changes, and vendor performance should be measured against the work each vendor controls. The baseline should include a small number of charts, using a deployment timeline, a cycle-time distribution, a rework ledger, and a scope-churn trend, since four clear visuals beat a 30-page metrics pack, and every chart should answer one executive question about whether the team can ship, whether shipped work fails, where work waits, and which scope changes consume capacity.
Days 7 to 9 inspect code and architecture hotspots
Use the metric baseline to select inspection targets, reviewing modules with high defect recurrence, long PR cycle time, repeated rollback history, or high business exposure, and avoid random sampling when the delivery signals already show where risk concentrates. Senior engineers should inspect code structure, test coverage, deployment design, data model choices, and integration contracts in a technical review with evidence, source links, and severity ratings, and the output should distinguish repairable defects from structural constraints. The inspection should include the release path, reviewing environment parity, migration scripts, feature flag use, secrets management, rollback procedures, and monitoring coverage, since many distressed projects fail during release even when the code itself is acceptable.
The review should produce a ranked defect list rather than a broad technical backlog, where each item names the risk, affected workflow, evidence, proposed repair, owner, and expected signal movement, and leadership should fund the repairs tied to the measured constraint. The inspection should include at least one production incident trace, following the incident from deploy record to alert, triage, rollback or hotfix, and customer effect, which reveals whether the team can recover under pressure. The review should also identify missing test evidence, since a passing CI badge is insufficient when critical workflows lack end-to-end coverage, and the team needs to know which tests protect revenue, compliance, and customer activation.
Days 10 to 14 present the rescue diagnosis and decision options
The final output should be a board-ready rescue memo. It should name the primary failure mode, quantify the cost of continuing unchanged, and present three options to continue with targeted intervention, reset scope and delivery model, or replace the team or vendor, and each option should include cost, timeline, risk, and the signal that will prove progress. A strong memo includes numbers, for example deployment frequency falling from weekly to once every 31 days, rework reaching 28% of closed tickets, median acceptance latency reaching 7 business days, and 4 of the last 9 releases requiring hotfixes, and the memo should cite the systems behind each number. The memo should also state what leadership should stop funding, so if the constraint is release safety, new feature expansion should pause, and if the constraint is acceptance latency, adding engineers will add more work to a blocked queue.
The decision options should be written in operational terms. “Continue” should mean a funded 30-day intervention with named owners and signal targets, “reset” should mean a changed release scope, changed governance model, and changed date, and “replace” should mean vendor transition, knowledge transfer, access transfer, and continuity coverage, since a replacement decision without a transition plan creates a second failure and the memo should state the first 10 days of that transition. The memo should include an executive appendix with source links, because board members do not need every ticket detail in the main narrative but do need confidence that each number traces back to a system of record. The final page should be a decision request stating the recommended option, funding required, owner, 30-day signal target, and next review date, since ambiguous rescue memos create another governance delay.
What executives should fund after the baseline
The rescue budget should follow the measured constraint. If deployments are rare and risky, fund release engineering, if requirements churn weekly, fund product governance and scope control, if defects repeat across the same code paths, fund senior engineering repair, and if vendor delivery signals remain poor after clear quality gates, replace the vendor. Each funding decision should map to one failing signal. The same evidence discipline that decides whether to keep a struggling team also decides whether to sign a new one, and our guide to vetting a software agency using delivery evidence applies the same source-linked records before a contract rather than during a rescue.
The first two weeks can predict whether a delivery team can recover, and the principle applies to internal teams and vendor teams alike, since evidence from the delivery system gives leadership a defensible basis for continuing, resetting, or replacing the team. Executives should require one artifact before approving additional spend, a raw-signal rescue baseline covering deployments, defects, rework, cycle time, incidents, and scope churn, then ask for the records behind the summary and fund the intervention that moves the failing signal within 30 days. This discipline protects capital, because a distressed software project consumes budget through payroll, vendor fees, cloud spend, delayed revenue, support burden, and executive attention, and raw delivery signals show which cost is controllable and which intervention deserves the next dollar.
For a CTO, the next step is direct. Within 48 hours, request read-only access to Git, CI/CD, Jira or Azure DevOps, incident records, release notes, analytics, and cloud audit logs, then assign one senior operator to build the 8-to-12-week baseline and present a 30-day rescue decision with source-linked evidence. Do not approve a new delivery date until that baseline exists, do not add headcount until the constraint is named, and do not fund a rescue plan that lacks a measurable signal, an owner, and a 30-day decision point.
The discipline is simple to describe and difficult to maintain, since under pressure organizations prefer plans that sound decisive, and raw delivery signals force the harder conversation about how the system behaves. That conversation is the start of rescue, giving leadership the facts needed to protect capital, preserve customer commitments, and stop funding work that does not move production delivery, so the project can then continue, reset, or end with evidence instead of narrative.
Algorithmic runs technical due diligence and delivery audits that turn deployment logs, defect history, and scope churn into a funded rescue decision. Start a conversation if a project is slipping and you need to know which constraint to fund before you approve the next date.