
For a recent enterprise client of ours, we saw a $180K warehouse grow to $520K in 18 months without a vendor price change. The growth comes from duplicate transformations, unmanaged BI workloads, unnecessary data movement, and product features that query analytical systems without cost controls.
This made us want to write this article and cover what are some best practices to make sure enterprises can keep such costs under control. Warehouse cost appears as infrastructure spend, and that view misses the operating mechanics behind the expense. Vendor pricing sets the base rate. Data infrastructure architecture, workload governance, and ownership discipline shape the run-rate. CFOs, CTOs, and data platform leaders need a cost attribution model before reviewing warehouse, lakehouse, BI, and managed pipeline contracts. Contract negotiation without workload evidence changes unit prices. Waste remains in the system and returns in the next renewal cycle.
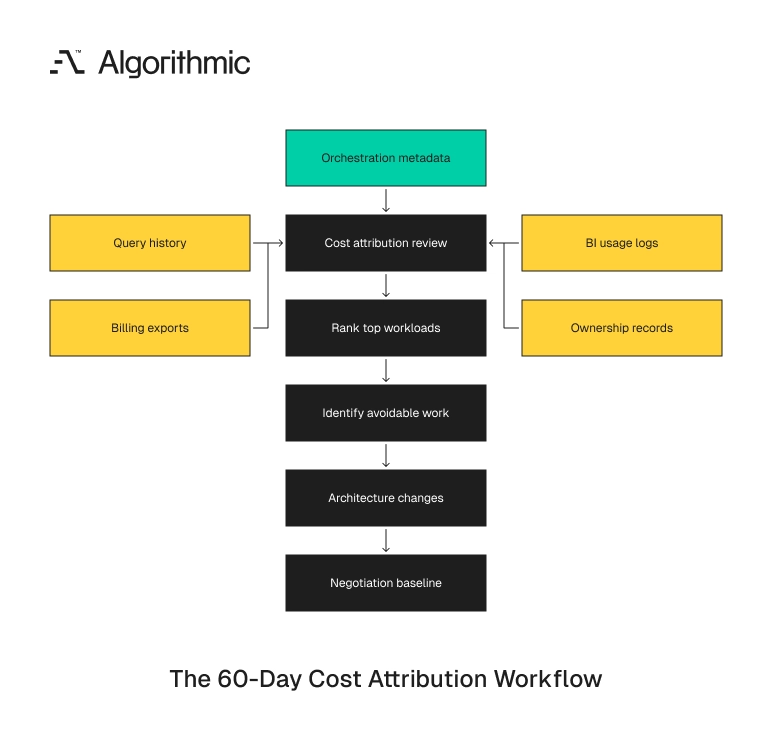
A useful cost review starts with one question. Which workloads contributed the most to this invoice? The answer comes from billing exports, query history, orchestration metadata, BI usage logs, and ownership records. Department-level allocations are too coarse for modern data platforms.
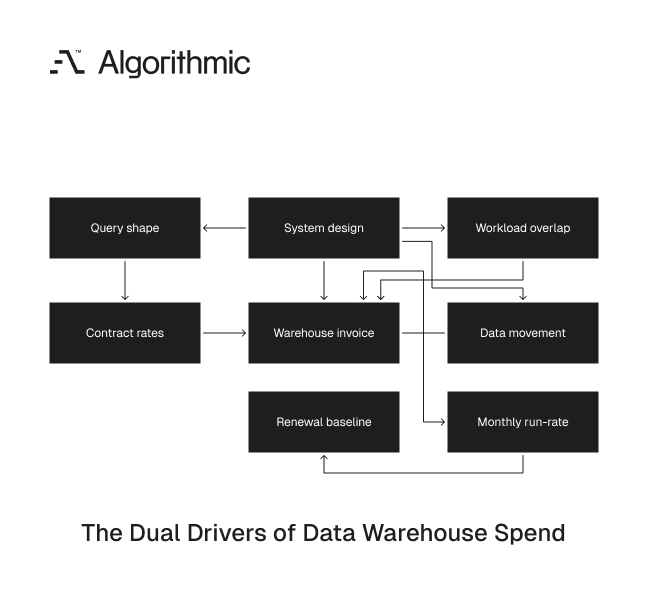
Warehouse spend comes from contract rates and system design
Cloud warehouse pricing is difficult to read because each platform uses different billing units. Snowflake uses credits, BigQuery uses bytes scanned, slots, and editions. Redshift uses node types, reserved instances, and serverless RPUs. Databricks uses DBUs, cluster policies, SQL warehouse sizing, and cloud infrastructure charges. BI and ingestion tools add their own pricing models.
 Click to expand
 Pricing guides explain these mechanics in useful detail. MotherDuck has published a detailed analysis of Snowflake, BigQuery, and Redshift total cost. Those comparisons help procurement teams understand vendor pricing.
Engineering leaders still need to measure what their workloads do. A platform with a lower unit rate costs more when query shape, concurrency, storage duplication, and movement patterns are unmanaged. The invoice reflects both the contract and the architecture. The larger cost problem appears after adoption. A warehouse starts as a reporting layer for 20 dashboards. Within 18 months, it becomes shared compute for finance, product analytics, customer success, ML feature generation, reverse ETL, embedded analytics, and notebooks.
At that point, the invoice no longer maps cleanly to business use. Finance sees a platform charge. Engineering sees thousands of jobs, queries, notebooks, BI extracts, and API calls. Product leaders see dashboards and customer-facing features with no cost per user or cost per request. The organization lacks a shared record of which workloads create which costs. That gap lets spend compound without a clear owner.
A team can negotiate a 15% lower credit rate and still increase total spend by 60%. The reduction in unit price disappears when unmanaged workloads grow faster than contract savings. Cost control starts with evidence about workload behavior. The evidence must include execution frequency, data scanned, elapsed time, concurrency, and owner. It should also include business function, product dependency, and retirement status. These fields turn a warehouse bill into a management record.
A $40,000 monthly warehouse bill has different meanings across three companies. One firm runs regulated revenue reporting and customer-facing analytics from the platform. Another carries old experiments, duplicate feature pipelines, and full-refresh dashboards. The same invoice total can represent necessary production work or avoidable waste. Finance cannot distinguish those cases from a vendor bill. Engineering must provide the workload map.
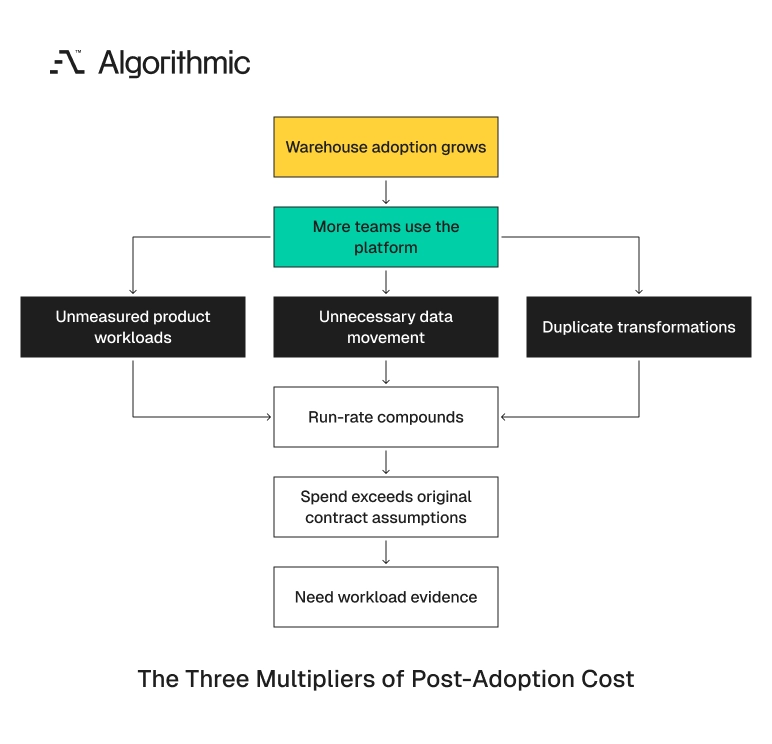
Three cost multipliers appear after adoption
Warehouse overruns rarely come from one large query. They come from repeated patterns that become normal operating practice. The same behavior runs every hour, every day, across production systems.
 Click to expand
 Three patterns account for most avoidable run-rate growth. Managed services overlap, data moves through unnecessary protocol hops, and product workloads use analytical systems without unit economics. Each pattern is fixable with ownership, measurement, and architecture discipline. Each pattern becomes expensive when teams treat the warehouse as unlimited shared capacity.
These multipliers also reinforce one another. A product analytics endpoint can trigger a BI tool, which triggers a warehouse query, which reads duplicated tables built by separate pipelines. One customer request then touches four cost centers. The financial control must follow the technical path. A line item labeled “warehouse credits” hides too much information. The cost record needs to show the path from user action to compute spend.
Overlapping managed services
A common enterprise stack includes a warehouse, a lakehouse platform, managed ingestion, dbt Cloud, reverse ETL, BI, orchestration, and a feature store. Each tool has a valid use case. Overlap appears when multiple platforms perform the same transformation, scheduling, storage, or governance work.
A company with 150 engineers reaches seven figures in annual data platform spend without one owner for lineage, cost allocation, and workload priority. The overrun comes from unmanaged layering. No single vendor owns the waste pattern.
A managed service earns its cost when it removes operational work that the organization would otherwise carry. It becomes expensive when it duplicates a function already handled by another layer. Kafka on Kubernetes, managed Kafka, warehouse tasks, Spark jobs, and Airflow can all schedule or move data. Running all of them requires a clear workload reason. A team should state which system owns ingestion, transformation, orchestration, serving, and backfills. Ambiguous ownership creates duplicate compute and duplicate storage.
This pattern begins with local decisions. A product team adds reverse ETL for lifecycle emails. A finance team adds a separate transformation workflow for revenue reporting. An ML team adds a feature pipeline that rebuilds tables already modeled in dbt. After six months, three teams compute the same customer status field with different logic and different cost profiles. The warehouse pays for every version.
A concrete example is account health scoring. Customer success builds it in a BI semantic layer. Product analytics builds it in dbt for activation reporting. The ML team builds it again in a feature pipeline for churn prediction. Each version joins accounts, users, events, support tickets, invoices, and product usage. The organization now pays for three daily rebuilds and three definitions of the same metric.
Overlap also appears in orchestration. Airflow triggers a dbt job, dbt triggers warehouse tasks, and the BI tool refreshes extracts on its own schedule. The same dependency chain runs three times because no team owns the full schedule. Storage overlap follows the same pattern. Raw tables remain in object storage, staged copies remain in the warehouse, curated copies remain in the lakehouse, and BI extracts add another copy. Each copy has a retention policy, access model, and compute path.
The solution requires a service inventory tied to workload ownership. Each managed layer needs a named purpose, an owner, a replacement condition, and a monthly cost. Tools without a defined production role should enter a retirement plan. A useful inventory includes five columns. Service, production function, duplicated function, monthly cost, and owner. The duplicated function column forces the discussion. Teams can see whether two tools both schedule jobs, transform the same tables, or serve the same metric.
Protocol hops and avoidable data movement
Every protocol hop adds cost, latency, and operational surface area. A common path extracts data from the warehouse through JDBC, converts it to JSON or CSV, transfers it into object storage, loads it into Spark, then writes results back into the warehouse for BI. That path charges compute at multiple points. It also creates failure modes across credentials, schemas, serialization, file sizing, network transfer, and retry behavior. The workflow becomes expensive and fragile.
Modern warehouse architecture should favor columnar execution and zero-copy or memory-sharing APIs when the workload permits them. Apache Arrow, Arrow Flight, DuckDB, Polars, and columnar execution engines reduce serialization overhead. Data stays in a columnar memory format instead of moving through row-oriented text formats. CSV export for routine analytical workflows is a warning sign. A required distributed cluster for straightforward transformations is another warning sign. The data path should have as few protocol transitions as practical.
A recurring 300 GB daily export can create six separate cost events. The path scans the warehouse, runs export compute, writes object storage, reads into Spark, runs Spark compute, and reloads warehouse tables. The engineering team sees one pipeline while the finance receives six charges across three invoices. The same pattern appears in embedded analytics. A product service calls a reporting API. The API triggers a live BI query.
The BI layer queries the warehouse, writes a cache file, and sends a JSON result back to the application. That sequence repeats for each customer account. The product feature now pays for application compute, BI compute, warehouse compute, storage, and network transfer. Data movement also creates hidden labor cost. Engineers debug schema drift, failed retries, and partial reloads across systems. A single type change from INTEGER to NUMERIC can break a CSV-based path and trigger manual repair.
Columnar interfaces reduce that operational load. Arrow preserves types across process boundaries. Parquet preserves column statistics that query engines use for pruning. The cost review should draw each high-volume path as a sequence diagram. The diagram should name the engine, format, transfer size, schedule, owner, and downstream consumer. That diagram finds the engine that adds cost without adding production value.
A protocol map becomes more useful when teams add transfer volume. A daily 5 GB path deserves routine monitoring. A daily 500 GB path deserves engineering review before the next renewal.
Unmeasured product workloads
Analytics infrastructure increasingly supports product features. Examples include customer-facing dashboards, usage analytics, recommendations, entitlement reporting, fraud review queues, billing analytics, and admin consoles. These workloads run on product traffic. Product workloads differ from internal BI. A dashboard used by 40 internal employees has a different cost profile from an embedded report opened by 12,000 customers. The query can be identical, and the financial model changes.
Cost attribution must connect warehouse spend to product flows by tagging requests and measuring cost per endpoint. Report infrastructure dollars beside daily active users, revenue, and gross margin. The top 10 cost drivers should be visible every week. This report should reach finance, engineering, product, and the accountable workload owner.
Without that view, teams reduce spend by removing visible work. High-cost work remains in place when it lacks an owner. Low-cost dashboards become targets because executives recognize their names. A product feature that costs $0.18 per customer session changes gross margin. The same query used by analysts for quarterly planning has a different financial meaning. Product and finance teams need the same unit economics view.
A useful product cost record contains four required fields. It names the endpoint, the owner, the monthly request volume, and the warehouse cost per 1,000 requests. It also records cache hit rate, average latency, and peak concurrency. That record turns an abstract warehouse charge into a product decision. A team can price a premium analytics feature, precompute account-level aggregates, or rate-limit heavy exports. The decision becomes grounded in unit cost.
Instrumentation should start at the application boundary. Pass a request ID, tenant ID, endpoint name, and workload class through the BI layer and warehouse query comment. The same identifiers should appear in logs and billing analysis. This practice allows teams to answer direct questions. A product leader can see the cost of the usage analytics tab for enterprise accounts. Finance can see whether a new customer cohort increases gross margin pressure.
The platform team should also measure cache behavior. A customer-facing dashboard with a 92% cache hit rate has a different cost profile from one with a 12% cache hit rate. The second design sends too many repeated requests into the warehouse.
Cost overruns show up after the warehouse becomes useful
The first six months of warehouse adoption look controlled. Data volumes are manageable, dashboards are few, and a small analytics team writes most queries.
Cost growth begins when the warehouse becomes central to the operating model. Marketing adds attribution models, finance adds revenue recognition tables, and product adds event-level funnels. Customer success adds account health scoring. ML teams generate features from the same event streams.
The Enterprise Data Infrastructure Benchmark Report 2026 reports that enterprises spend $29.3 million annually on data. The same report states that 97% report AI or analytics interruptions from pipeline issues, and 53% of engineering time goes to pipeline maintenance. The 2026 State of Analytics Engineering Report confirms the pattern, with 57% of teams reporting increased warehouse and compute spend against only 36% reporting increased team budgets.
Those figures match the pattern we see in production systems. Data spend increases as dependency increases. Maintenance work consumes senior engineering time when ownership is fragmented. Across 35+ complex engagements at Algorithmic, the highest-return warehouse reviews have started with cost attribution. Platform choice matters, but workload design produces the first 20% to 40% reduction in run-rate.
That reduction comes from removing duplicate work, isolating workloads, fixing high-cost queries, and eliminating avoidable movement. Vendor negotiation becomes more effective after that work. The buyer can forecast usage with evidence. A measured review also reduces internal argument. Finance can see which workloads serve revenue reporting, which support customer features, and which exist from old experiments. Engineering can defend necessary compute and remove low-value jobs with data.
One software company entered renewal with a $42,000 monthly warehouse bill and no workload-level map. The first report showed that eight jobs consumed 61% of compute. Four belonged to active product features, two belonged to finance reporting, and two had no active owner. The company retired the unowned jobs, rebuilt one full-refresh model as incremental, and moved an embedded analytics endpoint to precomputed account aggregates. Monthly run-rate dropped to $29,000 within seven weeks. The renewal conversation then used the lower baseline.
This pattern repeats because successful warehouses attract more use. A trusted warehouse becomes the default source for dashboards, exports, operational tools, and ML experiments. Success creates demand faster than governance matures. The inflection point arrives after the first executive dashboard gains trust. Teams then connect sales forecasting, customer health, marketing attribution, and product usage to the same platform. Each new dependency adds recurring compute.
Cost discipline must mature before that adoption wave reaches product surfaces. Once customers rely on analytical features, changes require product planning, communication, and release control. Early governance costs less than late remediation. A practical marker is monthly active warehouse users. When usage expands from one analytics team to five functions, the platform needs workload classes and budgets. When product endpoints enter the path, unit economics become mandatory. Teams facing a broader platform selection decision should read our guide on how to choose between a data warehouse and data lake, which covers the operating model that should precede vendor selection.
The 30-to-60-day warehouse cost attribution review
A warehouse cost review should produce a decision-grade fact base within 30 to 60 days. The output is a measured map of spend by workload, owner, data path, and business function. That map becomes the working record for renewal, remediation, and architecture decisions. The review should avoid broad debates about preferred platforms. It should answer which workloads cost the most, why they cost that amount, and who owns the decision. A small team can produce that record quickly with billing exports, query logs, job metadata, and interviews.
 Click to expand
 The review must cover four layers
| Layer | Evidence to collect | Common finding | Decision it supports |
|---|---|---|---|
| Compute workloads | Query history, job history, warehouse size, slot usage, cluster runtime | 5% of jobs consume 60% to 80% of compute | Tune, schedule, isolate, or retire |
| Data movement | Ingestion logs, object storage reads, egress, reverse ETL syncs | Same table copied through 3 tools | Consolidate movement and remove duplicate syncs |
| Transformation ownership | dbt models, notebooks, SQL scripts, stored procedures | Finance, product, and analytics rebuild the same metric | Assign canonical models and remove private copies |
| Product attribution | Request tags, API logs, dashboard usage, customer cohorts | Customer-facing analytics has no cost per account | Price, cache, precompute, or rate-limit |
This table becomes the operating artifact for CFO, CTO, and data platform review. Each row connects a technical pattern to a financial decision. The discussion moves from invoice totals to workload choices. The table also creates a common vocabulary. A CFO can challenge an unowned $18,000 monthly workload. A CTO can decide whether that workload needs tuning, migration, isolation, or retirement.
A simple attribution report should fit on one page. It should list the top workloads, the accountable owner, monthly cost, business function, remediation status, and next decision date. The report should also show whether the workload is internal BI, product-facing analytics, ML, ingestion, transformation, or ad hoc research.
In the below table is an example of what this looks like.
| Rank | Workload | Owner | Monthly cost | Business function | Finding | Decision |
|---|---|---|---|---|---|---|
| 1 | daily_events_full_refresh | Analytics Engineering | $14,800 | Product reporting | Full table rebuild scans 4.2B rows | Convert to incremental model |
| 2 | account_usage_embedded_dashboard | Product Engineering | $9,600 | Customer feature | Live queries run per customer session | Precompute account aggregates |
| 3 | finance_mrr_model_private | Finance Analytics | $6,900 | Revenue reporting | Duplicates canonical revenue model | Retire private model |
| 4 | ml_churn_feature_backfill | Data Science | $5,700 | ML feature generation | Backfill runs daily without model retraining | Reduce to weekly schedule |
| 5 | salesforce_reverse_etl_sync | RevOps | $4,200 | CRM sync | Sends unchanged records every hour | Add change detection |
This artifact changes the renewal conversation. A vendor invoice shows spend by service. This report shows which management actions reduce the next invoice. The report should also show trend direction. A $6,000 workload growing 18% per month deserves attention before it reaches the top rank. A flat $12,000 workload tied to required reporting has a different management path.
The first 10 days establish the cost map
Start with billing exports from the warehouse, BI platform, managed ingestion tool, transformation runner, orchestration system, and object storage. Normalize the data into daily spend by service, account, workspace, warehouse, project, database, and job. Use the same timezone and currency for every source.
Then tag owners so that every recurring query, dashboard, pipeline, model, notebook, and sync needs an owner. Treat unowned compute as a control finding, not an administrative gap. The early deliverable is a ranked list. It should include the top 20 workloads by cost, top 20 tables by scan volume, top 20 dashboards by warehouse load, and top 20 data movement paths by transfer volume. The list should include links to query text, schedules, and ownership records.
Teams should separate production workloads from development, experimentation, and abandoned assets. A notebook that runs daily under a former employee’s account is a control failure. A dashboard with 14 monthly viewers and a six-figure annual compute cost is a business decision. The first 10 days should also establish tagging standards. Snowflake documents cost attribution through object tags and query tags, and similar approaches exist in BigQuery labels and Databricks workspace tags. Use tags such as workload class, owner, business function, product area, environment, and cost center. Query comments, job labels, warehouse names, and orchestration metadata should all carry these fields.
A weak tagging scheme creates manual analysis every quarter. A strong scheme turns cost attribution into an automated report. The finance team should not need a senior engineer to interpret every line item. The first review should also identify billing gaps. Snowflake query history, BigQuery job metadata, Redshift system tables, and Databricks system tables expose different fields. The team should document which costs are directly attributed and which require allocation.
For shared warehouses, allocation uses query runtime, bytes scanned, or credits consumed. For BI tools, allocation can use dashboard refresh history and user activity. The method should be consistent enough for management decisions. Perfect attribution is unnecessary for the first report. A 90% accurate view of the top drivers beats a delayed model that arrives after renewal. The goal is to find the workloads that move the invoice.
Days 11 to 30 identify avoidable work
The second phase tests whether high-cost workloads are necessary, duplicate, or poorly shaped. The review should inspect query plans, partition use, clustering keys, materialized views, refresh frequency, joins, and scan volume. It should also compare modeled data grain with dashboard requirements. Common fixes include changing a dashboard from live query to scheduled extract. Teams also replace full table rebuilds with incremental processing. Other fixes include pruning event tables before joins and consolidating metric definitions into shared dbt models.
In BigQuery, partition pruning and clustering reduce scanned bytes when tables and predicates are designed correctly. In Snowflake, warehouse sizing and auto-suspend settings produce immediate savings. In Redshift, distribution keys, sort keys, and workload management settings change both cost and latency.
This stage also finds protocol hops. A pipeline that extracts 400 GB from Snowflake to object storage, processes it in Spark, and writes 400 GB back for dashboard use needs a documented reason. Many such jobs began as prototypes and stayed in production. The review should capture the original reason for each high-cost path. Some jobs serve regulatory reporting or customer commitments. Others exist because a team needed a workaround during a migration that ended nine months earlier. A before-and-after workload map makes the remediation concrete. Before remediation, a daily account metrics pipeline scans raw events, exports CSV, loads Spark, writes Parquet, reloads the warehouse, and refreshes BI dashboards. After remediation, the same pipeline runs an incremental dbt model, writes one serving table, and refreshes a scheduled extract.
That change removes two engines, three file conversions, and one reload step. It also gives one team ownership of the account metrics model. The savings come from a shorter path and a clearer owner. The review should classify each finding into four categories. Keep the workload, tune it, consolidate it, or retire it. Each category needs a decision owner and a target date.
Tuning applies when the workload is necessary and the query shape is inefficient. Consolidation applies when two teams produce similar tables or metrics. Retirement applies when no active process depends on the output. Keep decisions also require evidence. A high-cost workload can be justified when it supports revenue recognition, compliance, customer commitments, or material product revenue. The record should state the business reason and the review date.
Days 31 to 60 convert findings into operating rules
The final phase turns one-time analysis into governance. The organization should set budgets by workload class. Department budgets hide product traffic, shared services, and cross-functional pipelines. Internal BI, executive dashboards, customer-facing analytics, ML feature generation, experimentation, and ad hoc analysis need separate controls. A single shared warehouse for all of them creates priority conflicts and weak accountability. Workload classes should have different budgets, schedules, concurrency limits, and alert paths.
Cost alerts should go to workload owners, platform administrators, and finance when thresholds are crossed. A daily budget breach in a product analytics job needs the product engineering owner in the loop. Finance should receive weekly top-driver reports, avoiding monthly surprises. Operating rules should include approval thresholds. For example, any new recurring workload above $1,000 per month should have an owner, schedule, retention policy, and rollback plan. Any customer-facing analytical endpoint should report cost per 1,000 requests.
Rules should also define exception handling. A regulatory reporting workload can justify a high monthly cost. The exception should name the requirement, the owner, the review date, and the evidence. Governance fails when approvals become abstract. A good rule connects a threshold to a concrete action. For example, a query that scans more than 5 TB daily requires review by analytics engineering and the platform owner.
The 60-day endpoint should produce operating rituals. A weekly review covers the top drivers and new budget breaches. A monthly review covers trend direction, owner changes, retired workloads, and renewal assumptions. Quarterly governance should update the service inventory. It should confirm that managed tools still have a production role. It should also check whether temporary exceptions have expired.
This cadence keeps the cost map current. Teams change products, rename pipelines, and move workloads between systems. Cost attribution decays without routine maintenance.
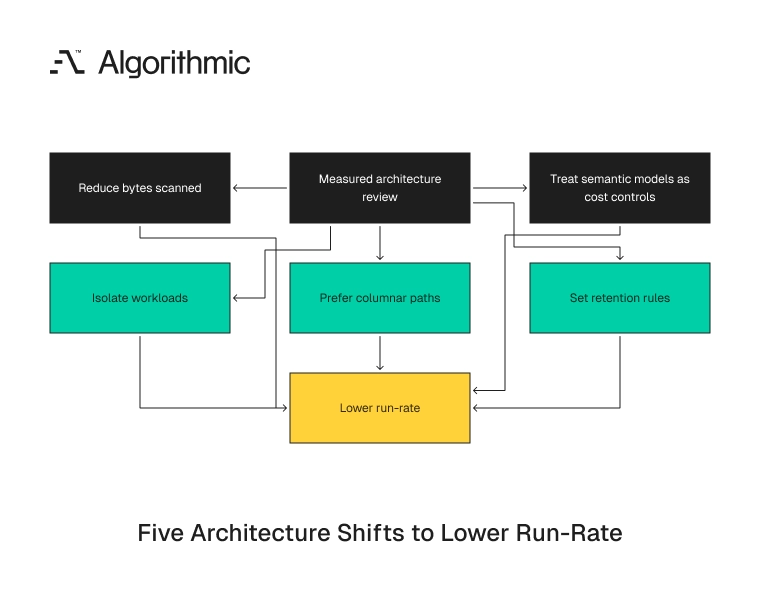
Architecture changes that reduce warehouse run-rate
Cost reduction work should avoid broad replatforming until the current architecture is measured. Several architecture changes have high return and low migration risk. These changes target workload behavior instead of contract terms. The strongest changes share one property. They reduce recurring work in production. They do not depend on one-time cleanup or extraordinary effort from the platform team.
The right order matters here. Measure workload behavior, fix repeated waste, then negotiate or replatform. This sequence preserves engineering time and avoids large migrations built on weak assumptions.
 Click to expand
 Isolate workloads by behavior
Interactive BI, batch transformations, reverse ETL, and customer-facing queries have different patterns. They should not compete for the same compute pool without controls. Their latency needs, concurrency patterns, and failure modes differ.
Use separate warehouses, projects, clusters, or slot reservations for each workload class. Apply auto-suspend and auto-resume settings where supported. Set query timeouts for ad hoc work and require scheduled execution for heavy recurring jobs. This gives teams cost boundaries. It also prevents a data science notebook from degrading executive reporting. A customer-facing endpoint should not inherit analyst query behavior.
Isolation also improves incident response. When a batch job consumes all available compute, the platform team can throttle that class without affecting dashboards or product endpoints. This reduces the operational blast radius. A practical pattern uses five pools. One serves executive and operational BI. A second runs scheduled transformations.
A third serves customer-facing analytics. A fourth supports ML and experimentation. A fifth handles ad hoc analysis with stricter timeouts and spend caps. Isolation should match business risk. Customer-facing analytics needs latency and availability controls because customers see failures. Ad hoc analysis needs guardrails because exploratory queries produce unpredictable scans.
Teams should set different defaults for each pool. A BI pool can use short auto-suspend windows and moderate concurrency. A transformation pool can run on schedules and pause outside batch windows. The product analytics pool should expose unit cost. It should also apply caching, precomputation, and rate limits. Those controls protect gross margin as customer traffic grows.
Reduce bytes scanned before reducing headcount or vendors
High scan volume is a design issue. Partitioning, clustering, column selection, pre-aggregation, and dimensional modeling reduce compute without changing platforms. These changes also improve query performance.
A fact table with 4 billion event rows should not be scanned in full for a dashboard that displays weekly account activity. The serving table should match the query pattern. Data warehouse architecture should be structured around the questions the business asks daily. Platform-level tactics matter, and each warehouse has its own tuning controls. The engineering work sits one layer deeper. Query shape, model grain, ownership, and refresh policy. Those decisions determine how much work the platform performs.
Teams should review scan volume before blaming user behavior. Analysts write expensive queries because the modeled tables force them to scan too much data. A better model removes waste at the source. A common remediation is account-level pre-aggregation. The warehouse writes daily account metrics once instead of scanning raw events for every dashboard load. Dashboards query the smaller serving table.
This pattern reduces scan volume and gives product teams a stable contract. It also makes caching easier because the serving table changes on a predictable schedule. The warehouse does less repeated work.
Column selection also deserves attention. A dashboard that reads 8 columns should not scan a 240-column event table. Narrow serving tables reduce scan cost and improve cache behavior. Join shape matters as much as table size. A high-cardinality join between raw events and slowly changing dimensions can multiply intermediate data. Pre-resolved dimension keys remove that repeated work.
Refresh frequency should reflect business use. A finance dashboard used for weekly close rarely needs hourly rebuilds. A product usage endpoint can need minute-level freshness for a specific customer flow.
Prefer columnar paths and zero-copy interfaces
Analytical data is columnar by nature. Systems that preserve columnar formats reduce CPU time, memory pressure, and serialization overhead. They also reduce type conversion errors.
For Python and ML workflows, Apache Arrow-backed paths are preferable to CSV exports and row-by-row conversions. For local analytical workloads, DuckDB and Polars can handle large columnar datasets without a distributed cluster. For service-to-service analytical transport, Arrow Flight reduces protocol overhead compared with text-oriented transfers. The rule is direct and applies everywhere. Fewer copies, fewer formats, fewer engines. Each added engine must justify its cost with a workload requirement that the existing platform cannot meet. That requirement should be documented in the workload inventory.
Columnar paths also reduce operational risk. Fewer conversions mean fewer schema drift failures, fewer type mismatches, and fewer retry loops. The cost benefit and reliability benefit come from the same architecture choice. CSV remains useful for exports to humans and some external systems. It is a poor default for recurring analytical pipelines. A daily CSV round trip through object storage should trigger architectural review.
A practical replacement path uses Parquet or Arrow for machine-to-machine movement. The workflow should preserve schema, compression, and column statistics. It should also avoid full reloads when incremental reads meet the need. Local analytical engines deserve a place in the architecture. DuckDB can process Parquet files directly for many development and analytical tasks. Polars can process columnar frames efficiently in Python workflows.
These tools reduce unnecessary cluster use. A 20 GB local analytical task does not need a distributed Spark job by default. The platform team should document the threshold where distributed compute becomes justified.
Set retention rules by data stage
Retention policy has a direct cost effect. Raw data, staged data, modeled data, and serving data should have different retention periods. Treating every layer as permanent storage raises cost and weakens governance.
A raw event table can need 13 months for audit or model training. A staging table can need 30 days. A serving aggregate can need seven days when it can be rebuilt from modeled data. Teams keep all layers indefinitely because deletion feels risky. That practice turns storage into an unmanaged liability. A documented rebuild path allows shorter retention without weakening trust.
Retention rules should be tested quarterly. Sample deleted partitions, confirm restore procedures, and verify downstream models. Data deletion is an engineering process, not a one-time cleanup task. The retention policy should also define ownership. Data platform teams should not decide alone which finance, compliance, and customer analytics records remain available. Business owners must approve retention periods for their data products.
A strong policy states the stage, retention period, rebuild source, owner, and exception path. For example, raw clickstream events remain for 13 months, staged session tables remain for 45 days, modeled account aggregates remain for 25 months, and temporary experiment tables expire after 14 days. Exceptions require a named owner and a review date. Retention should include temporary and intermediate assets. Temporary experiment tables, analyst scratch schemas, and backfill outputs survive long after the work ends. Expiration defaults reduce that accumulation.
Access logs also inform retention decisions. A table with no reads in 180 days and no documented compliance use deserves review. A table used every close cycle deserves a defined owner and retention reason.
Treat semantic models as cost controls
Metric definitions are architecture decisions. Revenue, churn, activation, retention, account health, and product usage should have canonical models. Private copies create inconsistent numbers and duplicate compute.
A semantic layer, dbt metrics model, or governed BI model can reduce repeated transformations. Ownership and adoption determine whether the layer reduces cost. Each critical metric needs one approved definition and one production path. This control also reduces rework during audits and board reporting. Finance should not reconcile three versions of net revenue retention. Product should not defend activation numbers built from a private notebook.
Metric governance has a cost benefit. When teams reuse canonical models, the warehouse performs fewer joins, fewer rebuilds, and fewer scans. The organization also spends less time arguing about which number is correct. A canonical model should have version control, tests, documentation, and an owner. It should also have a deprecation process for private copies. Teams need a migration path from old definitions to approved definitions.
Adoption requires enforcement in BI and transformation workflows. Dashboard authors should use approved datasets for board metrics, revenue metrics, and product KPIs. Exceptions should expire unless a business owner renews them. Semantic control also improves product analytics. Customer-facing reports should use the same account and usage definitions used internally. This avoids expensive reconciliation between product screens and executive dashboards.
Contract negotiation should follow architecture evidence
Procurement teams enter renewal discussions with invoice history and growth forecasts. That evidence is insufficient because vendors negotiate against committed usage, and weak usage data gives the vendor the advantage.
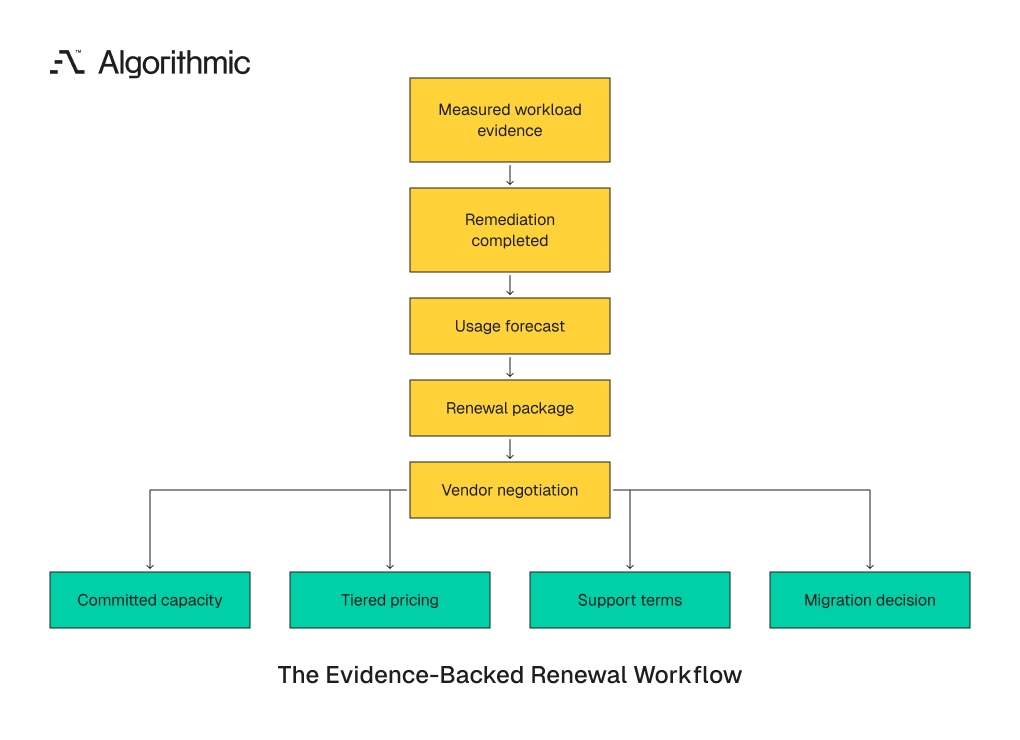
A stronger renewal package includes 12 months of spend by workload, projected growth by product path, query concurrency patterns, top cost drivers, data retention assumptions, and planned architecture changes. This allows the organization to discuss committed capacity, tiered pricing, support levels, and contract terms from a measured position. It also separates growth from waste.
 Click to expand
 Contract decisions should also account for lock-in created by proprietary features. A warehouse task framework, notebook platform, BI semantic layer, and managed ingestion tool can all become migration barriers. The review should identify portable SQL, platform-specific logic, and code that requires a rewrite. Replatforming is justified when measured workload needs conflict with the current platform’s pricing model or execution model. Invoice frustration alone does not justify migration. Migration costs, parallel run time, validation, retraining, and governance rebuild work can exceed first-year savings when the decision lacks evidence.
The negotiation package should include remediation already completed. Vendors respond differently when the buyer has reduced waste, classified workloads, and forecast growth from actual usage. That position supports better terms and better internal decisions. A renewal package should also include a usage floor and a controlled growth model. The floor reflects stable production workloads after remediation. The growth model reflects product traffic, new markets, ML demand, retention needs, and known regulatory reporting requirements.
This distinction matters because committed spend is difficult to unwind. A team that commits against inflated usage locks waste into the contract. A team that commits against measured demand can negotiate capacity, discounts, and support without funding abandoned work. The same evidence supports build-versus-buy decisions. If a managed pipeline tool costs $240,000 per year and replaces two full-time platform engineers, the economics can be sound. If it duplicates orchestration already handled in Airflow and warehouse tasks, the contract funds avoidable overlap.
The renewal team should model three cases. The baseline case uses current run-rate after verified remediation. The growth case adds known product and data volume expansion. The downside case accounts for delayed remediation or unexpected customer traffic. This model gives finance a commitment range tied to operating facts. It also prevents a single inflated quarter from setting the contract floor.
Support terms deserve the same evidence. A platform supporting customer-facing analytics needs clear incident response terms and escalation paths. A platform used mainly for internal reporting has a different support profile. Legal and security teams also need the architecture record. Proprietary features, data residency requirements, and cross-region movement can affect migration options. These details should be visible before the commercial negotiation narrows.
Renewal checklist for CFOs, CTOs, and data platform leaders
 Click to expand
 Use this checklist before renewing warehouse, lakehouse, BI, or managed pipeline contracts.
- Spend attribution: Every recurring workload has an owner, business function, schedule, and monthly cost.
- Top-driver report: Engineering and finance review the top 10 cost drivers weekly.
- Workload isolation: Internal BI, batch transformations, customer-facing analytics, ML, and ad hoc work run under separate controls.
- Duplicate model review: Revenue, churn, activation, account health, and product usage metrics have canonical models.
- Protocol map: High-volume paths show each engine, file format, transfer point, and serialization step.
- Query plan review: The highest-cost queries have been inspected for scan volume, joins, partition use, and materialization strategy.
- Retention policy: Raw, staged, modeled, and serving data have defined retention periods.
- Managed layer test: Each managed service has a documented function that does not duplicate another platform.
- Product cost mapping: Customer-facing analytics reports cost per endpoint, account, or active user.
- Negotiation package: Usage forecasts reflect measured workloads after remediation and exclude last quarter’s inflated run-rate.
This checklist gives finance and engineering a shared language. It also prevents teams from treating the warehouse invoice as an isolated procurement issue. The renewal becomes an architecture and operating review. A renewal meeting should answer three questions with evidence. Which workloads drive spend? Which workloads support revenue, retention, or required reporting?
It should also identify which workloads can be tuned, isolated, consolidated, or retired before the contract is signed. The answer should come from query history, billing exports, workload tags, and ownership records. Opinion should not substitute for the fact base. A strong renewal file contains five artifacts. It includes a workload cost report, a top-driver trend, a protocol map, a retention policy, and a remediation log. Each artifact should have an owner and a review date.
The remediation log is especially useful. It records what changed, when it changed, who approved it, and how much spend moved. This gives finance confidence that savings came from structural changes instead of temporary cuts. The checklist should also assign decision rights. Finance owns the spend target and commitment range. Engineering owns architecture changes, workload isolation, and query remediation.
Product owns customer-facing analytical unit economics. Analytics owns metric definitions and dashboard governance. Data platform leadership owns the operating cadence across all groups. A renewal decision made without these roles produces partial accountability. Finance negotiates rates, engineering inherits operating constraints, and product continues to add traffic. Shared evidence prevents that split.
Start with a measured architecture review
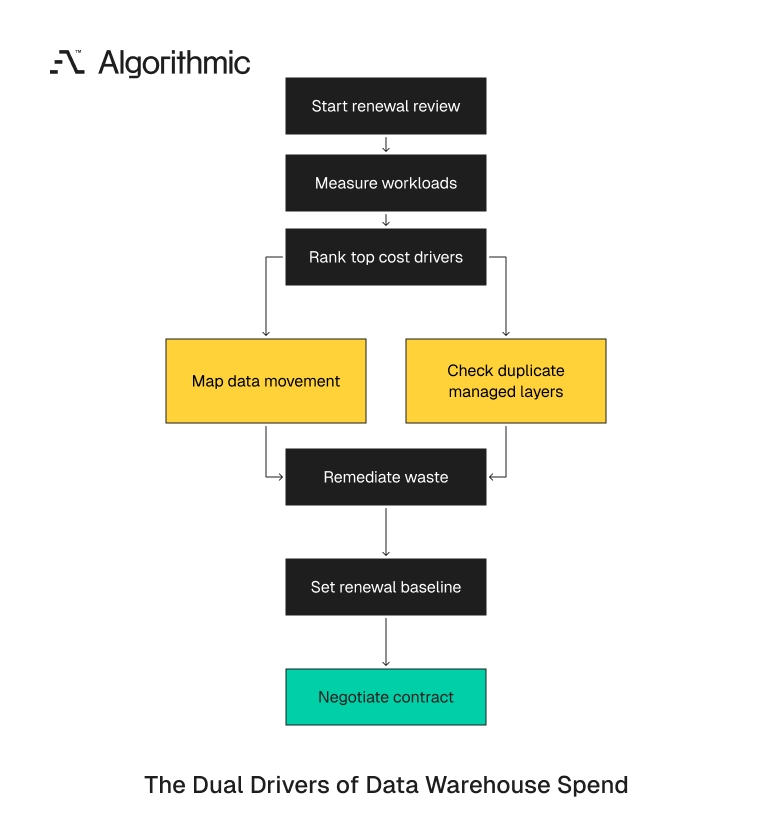
The next renewal should begin with a 30-to-60-day cost attribution and architecture review. Measure workloads, rank cost drivers, map data movement, and identify duplicate managed layers before committing to a new contract or migration plan. Do this work before the negotiation calendar controls the decision.
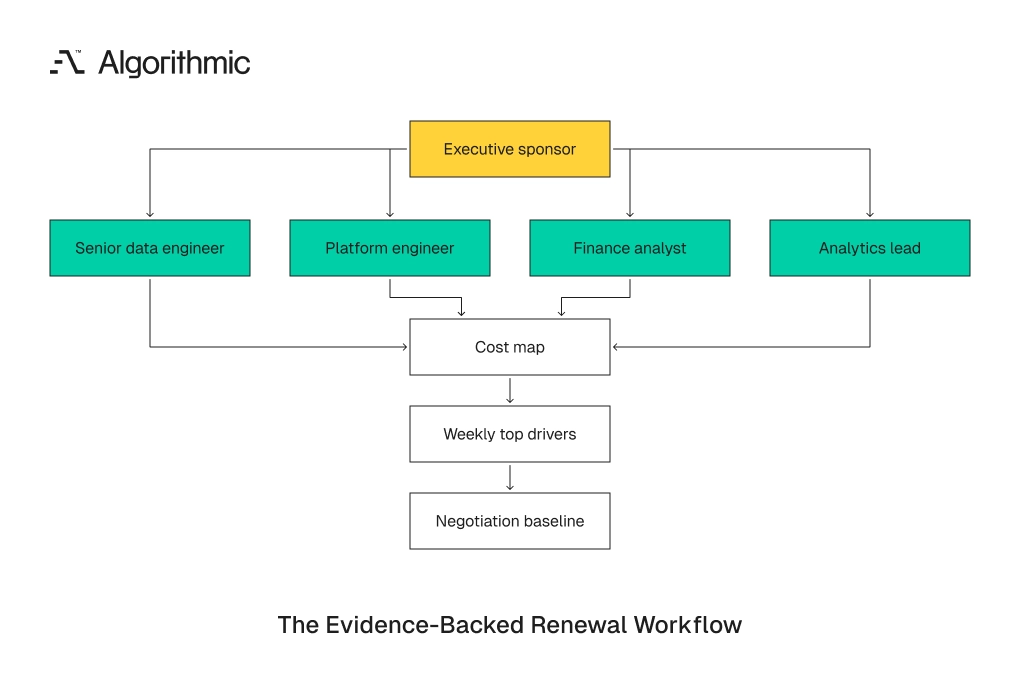
Assign one senior data engineer, one platform engineer, one finance owner, and one analytics lead to produce the fact base. Require weekly review of the top 10 cost drivers. Enter vendor negotiations after the architecture findings are complete.
 Click to expand
 The review team should have authority to pause new recurring workloads above the approval threshold. It should also have access to billing exports, query logs, BI usage data, orchestration metadata, and cloud storage records. Cost attribution fails when the team works from partial evidence. Warehouse cost control is an operating discipline. Organizations that manage it well treat cost as a property of architecture, ownership, and product design. The invoice then becomes a measurement artifact instead of the first warning sign.
The directive is straightforward. Build the cost map, assign owners, remove duplicate work, shorten data paths, and govern product workloads by unit cost. Then negotiate from the measured baseline. Algorithmic runs data infrastructure engagements that start with workload attribution and cost evidence before any architecture change or vendor negotiation. Start a conversation if your team is approaching a warehouse renewal or facing uncontrolled spend growth.