

A two-to-four-week instrumentation sprint can prevent a 90-day experimentation program from producing decisions the team cannot trust. Product, growth, and analytics leaders often fund A/B testing platforms before they can trust event capture, identity stitching, or metric definitions, which gives them process rigor without measurement rigor. The test has variants, sample sizes, and confidence intervals, and the telemetry can still point the team toward the wrong decision. Sound data infrastructure and integrations is what makes an experiment platform’s numbers worth trusting.
This failure is expensive because every later experiment inherits the same measurement defects. Teams rerun tests, rebuild cohorts, dispute dashboards, and delay roadmap decisions. In one SaaS environment, a 9% uplift in trial-to-paid conversion disappeared after analysts found that 14% of trial users were counted twice across web and mobile sessions.
Instrumentation is product infrastructure, and it belongs in the same planning cycle as the experiment roadmap. Teams that treat tracking as a backlog task create data defects that surface during executive readouts, and the cost compounds over time. One incorrect event definition can enter dashboards, board reports, customer segments, lifecycle emails, and model training data. By the time teams discover the defect, the correction requires code changes, warehouse backfills, dashboard rewrites, and renewed debate about past decisions.
Experiments inherit the quality of the measurement system
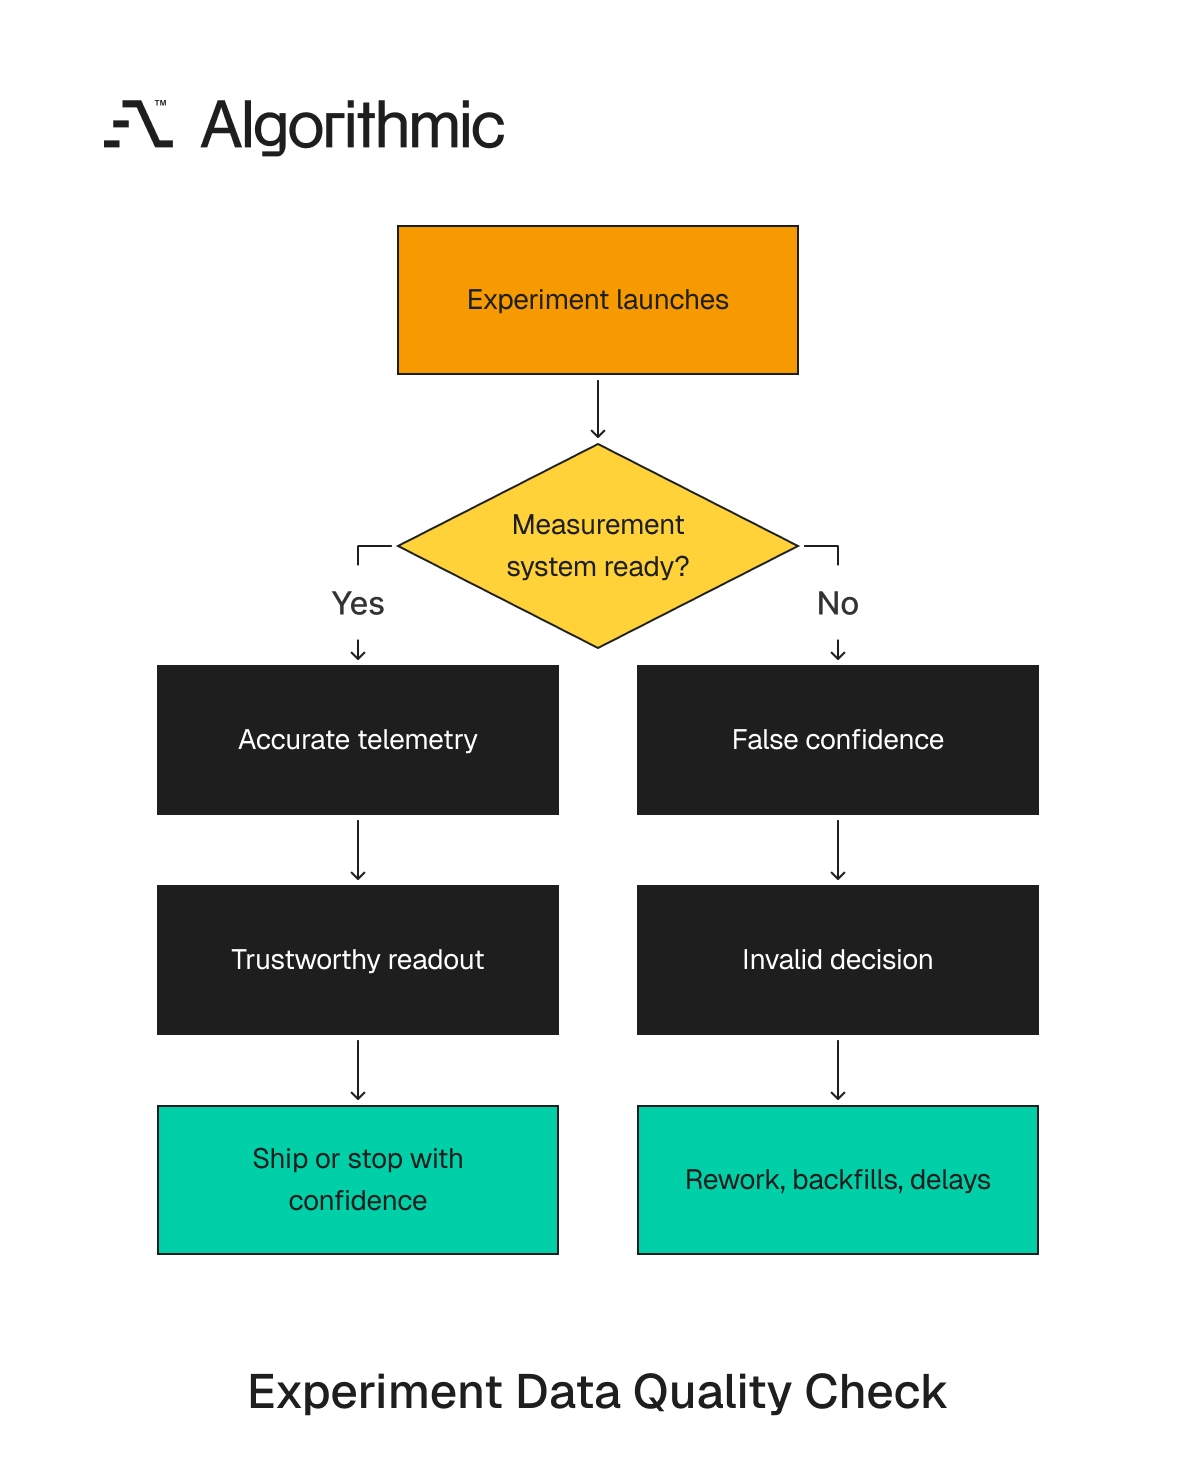
A/B testing discipline has matured, and teams now use pre-test power calculations, minimum detectable effect thresholds, sequential testing rules, and holdout groups. The statistical challenges in online controlled experiments are well documented, since weak statistical practice creates false positives. Statistical rigor still requires trustworthy inputs. A clean p-value cannot repair duplicate users, missing events, inconsistent timestamps, or a metric definition that changes between launch and readout, so a test with accurate assignment and weak telemetry produces weak evidence.
 Click to expand
 Experiment platforms such as Statsig, Optimizely, LaunchDarkly, Eppo, and GrowthBook assign variants correctly. They cannot infer whether the checkout_completed event fires after payment authorization, order creation, or a delayed webhook from Stripe, and that distinction changes revenue attribution, refund analysis, and cohort membership. The same gap appears in decision frameworks for underpowered experiments, where low traffic is one constraint and low-trust telemetry is a separate one that teams must fix before experiment volume increases.
A team with 8,000 monthly visitors can make disciplined decisions from directional evidence, while a team with 800,000 monthly visitors can make poor decisions if identity joins fail or conversion events fire at the wrong point. Traffic volume increases precision around recorded data, but data validity requires separate testing. This distinction matters in executive governance. A board or operating committee can accept a test that lacks enough traffic when the measurement limits are explicit, yet the same group loses confidence when a team presents precise numbers and later retracts them because the event model was defective.
Experimentation also changes organizational behavior. Once a company declares that product decisions will come from controlled tests, teams start routing roadmap choices through the experiment queue. Measurement defects then influence resource allocation, hiring priorities, pricing decisions, and sales enablement material.
Three instrumentation failures create false confidence
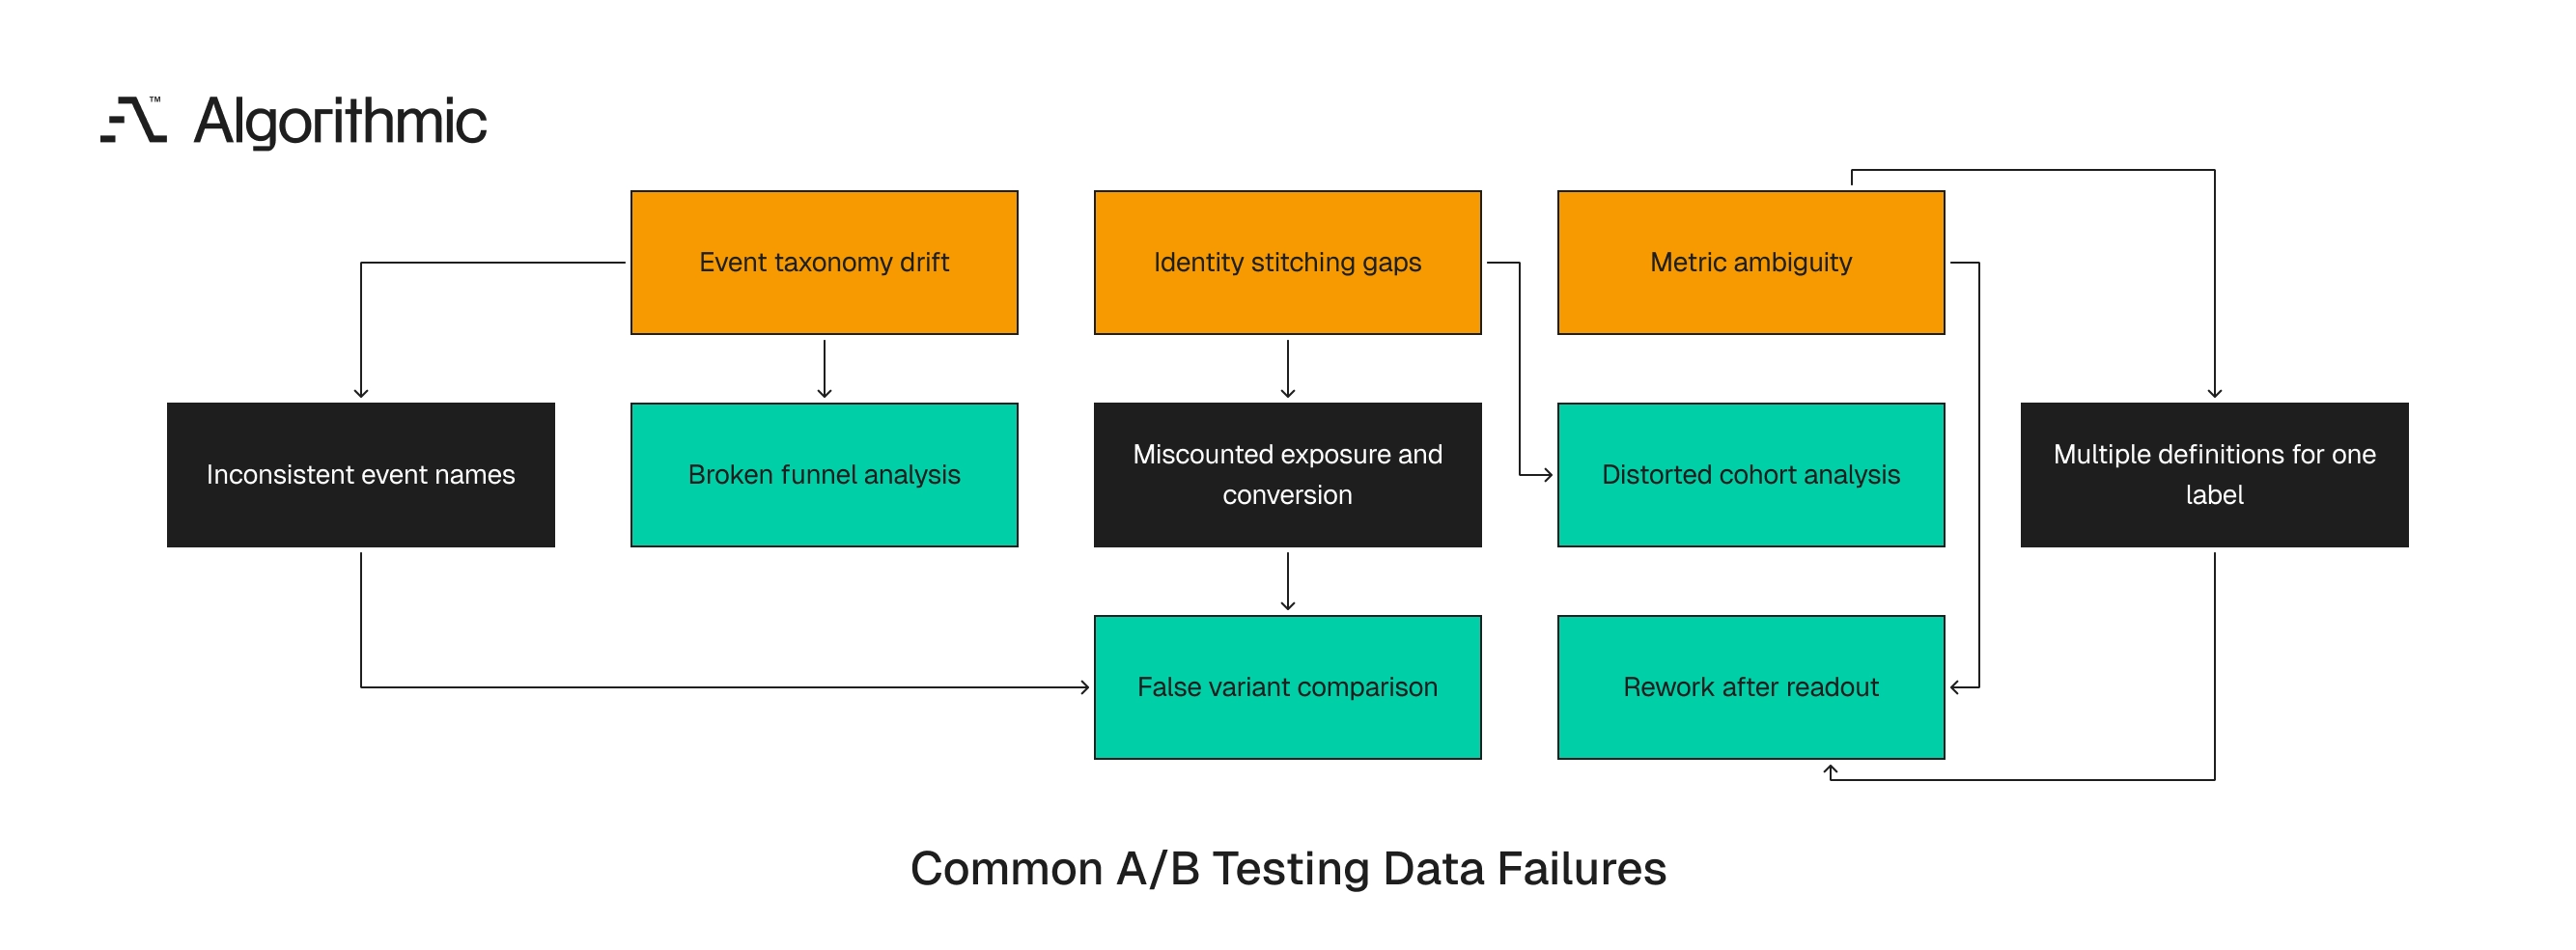
Experimentation programs fail in predictable ways when instrumentation starts after the roadmap has accelerated. The defects fall into three categories, event taxonomy drift, identity stitching gaps, and metric ambiguity, and each category can invalidate a test without triggering a warning in the experiment platform. These failures are operational. They appear in Jira tickets, Looker dashboards, warehouse models, and executive readout documents, and they compound because each experiment adds new events and metrics to an unstable base.
The platform usually reports that the experiment ran correctly. Assignment worked, sample size reached the threshold, and the dashboard refreshed on schedule. The decision still rests on a measurement system that recorded the wrong behavior.
 Click to expand
 Event taxonomy drift corrupts funnel analysis
Event taxonomy drift occurs when teams use different event names, payload fields, or firing rules for the same user action. A web team records signup_completed, a mobile team records registration_success, and a backend service emits user_created. All three events may refer to the same business event, or they can represent different lifecycle points, since signup completion can mean email submission, email verification, account creation, or workspace creation.
This defect becomes visible during funnel analysis. When a product manager asks for activation within seven days of signup, the analytics team must choose one signup event, merge three event streams, or write exception logic that one analyst understands. The defect compounds when experiments span surfaces, because a pricing test that starts on web and ends in mobile checkout will undercount conversions if the event contract differs by client, and the resulting dashboard can show lower conversion for the stronger variant.
A common variant appears during refactors. Engineering replaces a React checkout component and preserves the user interface behavior, but the new component fires checkout_started on page load instead of first user intent, which inflates the denominator for every downstream conversion metric. The same problem occurs when mobile releases lag web releases. Version 4.8 of an iOS app may send plan_selected while web sends pricing_plan_selected, and if the warehouse model treats both as equal, analysts lose the precision needed to compare channel behavior.
Event naming also affects support and incident response, since a sudden drop in subscription_started may represent a payment failure, a tracking defect, or a renamed event, and without a contract the team spends hours proving which system changed. Taxonomy drift damages historical analysis too. A retention query that spans 18 months can combine three versions of the same event, so the trend line reflects instrumentation history instead of customer behavior. The risk increases in companies with separate web, mobile, platform, and growth teams, each shipping code through different release cycles, because without a shared contract naming differences appear during ordinary delivery instead of during formal analytics work.
The correction requires discipline at capture time. Event names, trigger rules, payload fields, and deprecation dates must exist before the experiment enters engineering. Retrofitting taxonomy after launch leaves analysts to reconstruct intent from code commits and Slack threads.
Identity stitching gaps distort cohorts
Identity stitching maps anonymous sessions, device identifiers, authenticated users, workspace accounts, and billing records into one analytical identity. Without this layer, experiments miscount exposure, conversion, retention, and revenue, and the defect appears most often at the boundary between anonymous and authenticated behavior. A common failure occurs when a user sees a variant while anonymous, creates an account, then converts on another device. If the system cannot connect the anonymous ID to the user ID and account ID, the experiment platform records exposure without conversion and the variant underperforms in the report.
B2B SaaS products face a harder version, where the decision unit is often an account instead of a person. A workspace with 38 users may have one buyer, five administrators, and 32 end users, so user-level experimentation can conflict with account-level revenue metrics unless teams design the identity model before tests launch. A single exposed administrator can change billing behavior for the full workspace, and the measurement plan must define whether exposure occurs at the user, account, or workspace level.
Identity failures also distort retention. A returning user who clears cookies or changes devices can appear as a new user, an error that inflates acquisition metrics and depresses retention metrics at the same time. Account merges create another failure mode, since a customer may start as two workspaces, consolidate under one billing account, and retain historical activity under both account IDs, so revenue metrics become inaccurate unless the identity model records merge time and source system.
Privacy controls add necessary constraints. Apple App Tracking Transparency, browser cookie limits, and regional consent rules reduce client-side continuity, so teams need server-side identifiers, consent-aware joins, and clear rules for data gaps. Identity gaps also create false channel findings, because paid search can appear to produce low-quality users when its visitors convert later on desktop, mobile, or through sales-assisted checkout, and the marketing team then reduces spend against a channel that drove the original demand.
Enterprise sales motions add another layer, since a user can create a trial with a personal email, invite colleagues with corporate addresses, and convert through a procurement-owned billing record. The analytical identity must connect these records with dates, sources, and confidence levels. Without this structure, experiment analysis becomes a manual investigation where analysts inspect raw event logs, CRM records, billing system rows, and support data, and the evidence arrives after the operating window has closed.
Metric ambiguity turns debates into rework
Metric ambiguity occurs when the same label has multiple definitions. Activation may mean email verified, first project created, first teammate invited, first payment method added, or first successful workflow, and each definition can be defensible for a specific decision. This is one of the common metric interpretation pitfalls documented across companies that run tens of thousands of experiments a year. Ambiguity becomes costly after results are published. A growth team reports a 6.4% activation lift, finance sees no movement in paid conversion, and product sees higher support contacts from the new cohort. The team then spends three weeks explaining the discrepancy instead of making a roadmap decision, and in that period engineers keep shipping work against a metric the organization has not defined, so the cost appears as missed sequencing, delayed launches, and repeated analysis requests.
Metric registries prevent this failure. Each metric needs an owner, SQL definition, source tables, grain, exclusions, expected latency, and approved use cases, and the registry should sit in the same review path as dashboards, experiment readouts, and executive reporting. Metric ambiguity also affects incentive design, because if growth reports trial activation by user and finance reports conversion by billing account, both teams can appear correct and the company funds work against two incompatible scorecards.
The cure is operational discipline. Every experiment brief should link to the approved metric definition, including grain, time window, and exclusion rules, and if the definition changes, the experiment record should capture the version used in the readout. Ambiguity also damages guardrail interpretation, since a support contact rate can count tickets, unique customers, conversations, escalations, or resolved cases, and those definitions produce different answers during a launch decision. The same pattern appears in revenue metrics, where gross revenue, net revenue, recognized revenue, cash collected, and annual recurring revenue answer different questions, so product teams need the exact definition before a pricing or packaging experiment starts. Metric precision does not slow teams down. It prevents repeated meetings after the readout, and a 30-minute definition review before launch is cheaper than a three-week dispute after results circulate.
A two-to-four-week instrumentation foundation has four parts
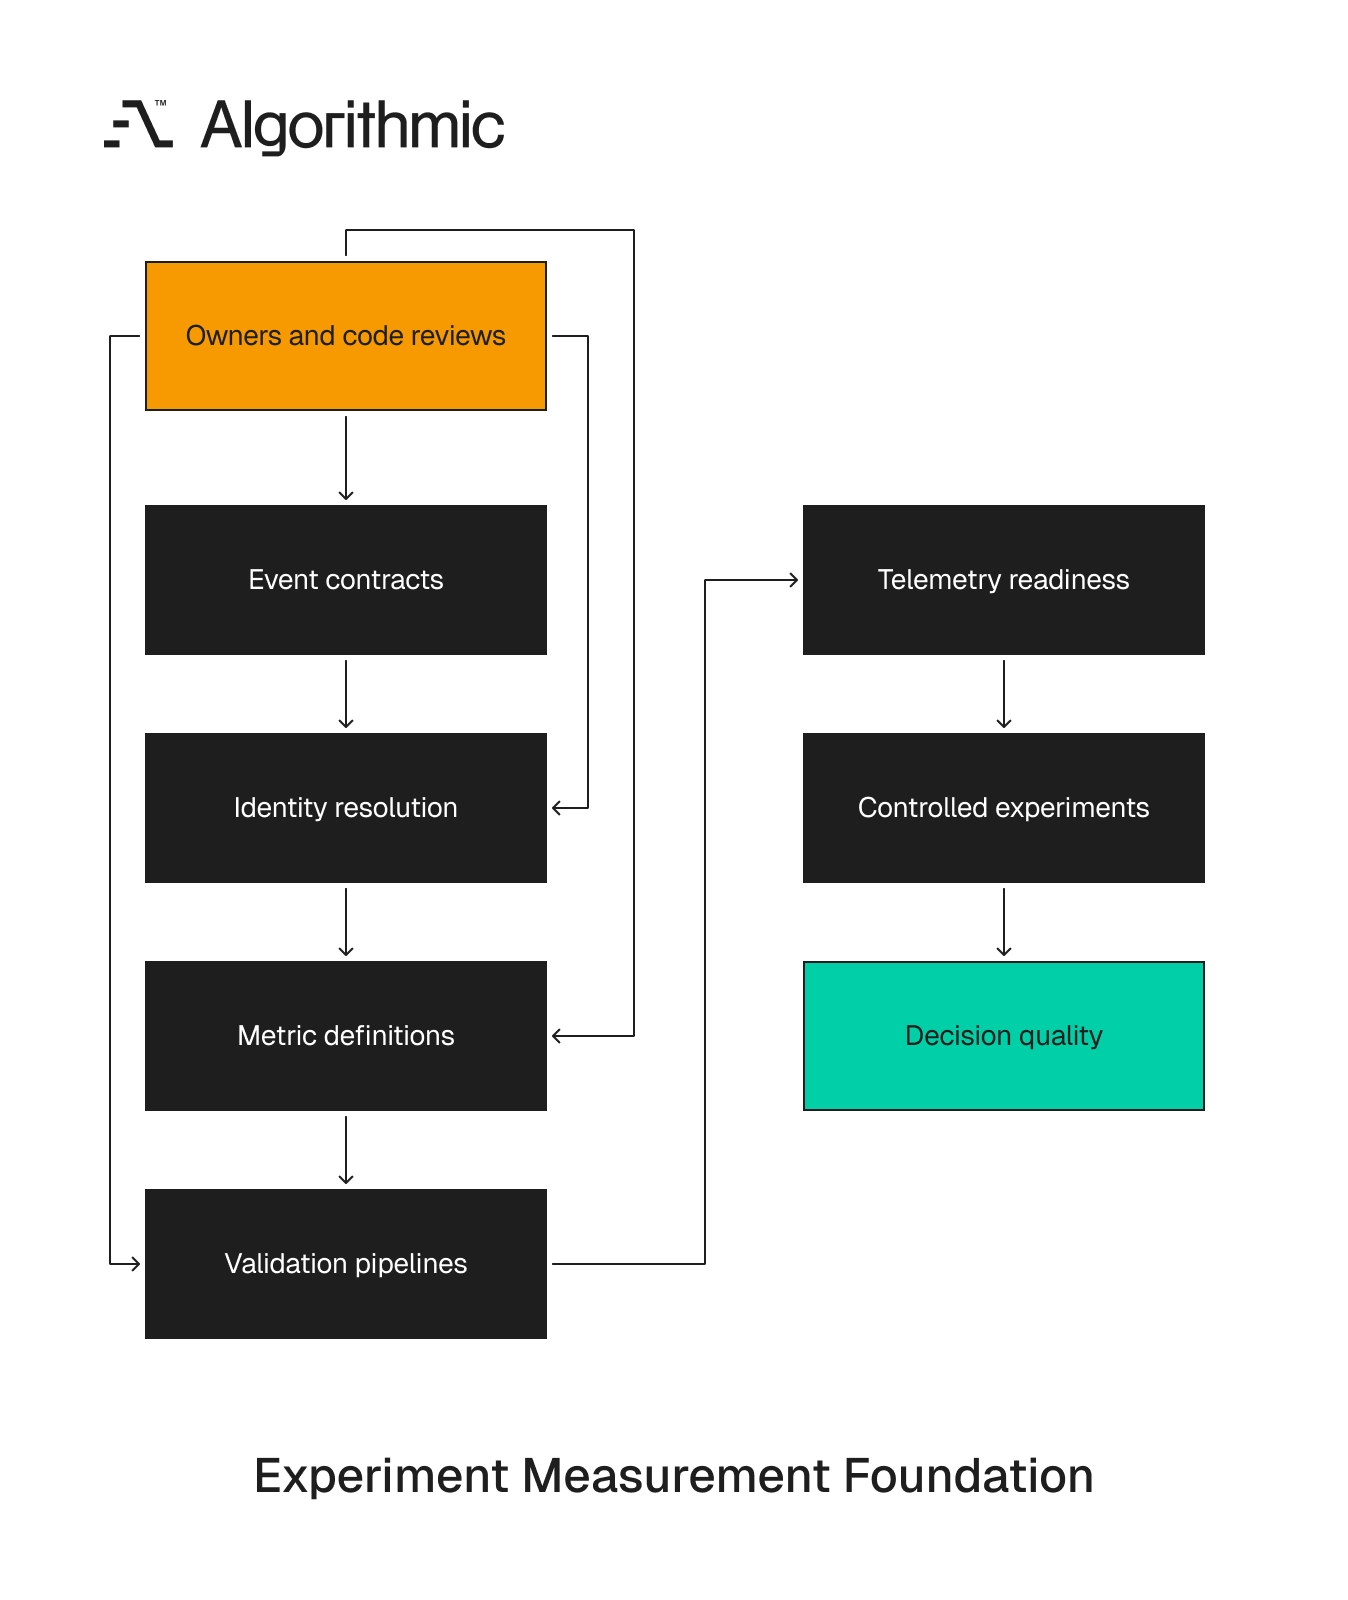
Instrumentation work does not require a quarter-long platform program. For most product teams, a focused two-to-four-week foundation supports the first 10 to 20 controlled experiments with confidence, and the work must produce contracts, code, and tests. It has four parts, event contracts, identity resolution, metric definitions, and validation pipelines, and these are separate workstreams with separate owners. Treating them as one analytics task hides the decisions that need senior review.
 Click to expand
 A small team can run these workstreams in parallel. Product and analytics can define the metric registry while engineering reviews capture points, and data engineering can add validation checks once the first event contracts are approved. The foundation should focus on the next experiments instead of the entire product history, because teams lose momentum when they attempt to redesign every event in the warehouse, and the practical starting point is the next 10 decisions the company plans to make. A short sprint also gives leaders a forcing function. It exposes unclear ownership, outdated dashboards, and event definitions that live in individual analysts’ notebooks, and these findings are management facts, not analytics preferences.
Event contracts define what gets captured
An event contract is a versioned specification for each product event. It defines the event name, trigger point, required properties, optional properties, data types, ownership, and downstream consumers, and the contract should be reviewed before engineering starts the experiment. For a checkout flow, the contract should distinguish at least five events, checkout_started, payment_method_added, payment_authorization_succeeded, order_created, and subscription_activated. These events answer different business questions, and combining them under purchase hides operational failures and conversion behavior.
A production-ready event contract should include:
- Event name and semantic meaning
- Trigger location: frontend, backend, webhook, or batch job
- Required properties and accepted values
- Identity fields present at capture time
- Timestamp source and timezone rule
- Schema version
- Owning team and Slack channel
- Deprecation policy
- Backfill rule for missed or corrected events
- Test fixture covering valid and invalid payloads
Tools such as Segment Protocols, Snowplow schemas, RudderStack transformations, and Amplitude Govern can enforce parts of this contract, but the hard work is the design decision followed by code review, and tool configuration only records the decision after the team has made it. For revenue and entitlement events, backend capture should be the default. Browser events are useful for interaction diagnostics such as clicks, impressions, scroll depth, and field errors, while revenue, account creation, and subscription changes require server-side evidence.
Event contracts also need lifecycle rules. A deprecated event should have an end date, replacement event, migration owner, and dashboard impact list, or old events remain in warehouse tables for years and distort longitudinal analysis. Versioning matters when teams ship multiple clients, so a contract change should specify which web build, iOS build, Android build, and backend service version emits the new payload, which prevents analysts from comparing two event versions as though they were identical.
The contract should also state idempotency rules, because payment systems, webhook processors, and retry queues can emit duplicate records during normal operation, and a stable event ID and deduplication rule prevent false conversion spikes. Sampling rules belong in the same contract. Teams often sample high-volume interaction events and retain all billing events, and analysts need that distinction before they calculate rates across mixed event types.
Identity resolution defines analytical truth
Identity resolution needs explicit rules. Teams should define how anonymous_id, user_id, account_id, device_id, email_hash, and billing_customer_id relate to each other. The rules should specify precedence when identifiers conflict.
A practical identity model separates three grains:
| Grain | Example identifier | Used for |
|---|---|---|
| Session | anonymous_id or device_id | Landing page, browsing, pre-auth behavior |
| User | user_id | Activation, feature adoption, retention |
| Account | workspace_id or billing_customer_id | Revenue, expansion, churn, B2B conversion |
This model prevents common errors. Keep user-level adoption metrics separate from account-level revenue lift, and attribute account-level churn to exposed users only after exposure rules are defined. The identity table should include creation time, merge time, source system, and confidence level for each link, since a deterministic join from authenticated login carries more weight than a probabilistic match from email domain, and analysts need this metadata when they explain gaps in experiment reports.
For privacy and compliance, the identity model should avoid raw email addresses in analytical tables. Hashes, surrogate keys, and access controls protect customer data and reduce the number of people with access to regulated fields. Identity resolution should also record deletion and suppression rules, because a GDPR deletion request, enterprise data retention policy, or legal hold can remove records from analytical tables, and the experiment readout should show when these rules affect sample size.
The model needs tests across real journeys. A user who starts on a paid search landing page, signs up on web, activates in mobile, and upgrades through billing should resolve to one user and one account, and if that journey fails, the experiment system will misread acquisition quality. Conflict rules need senior review, so if two user_id values connect to the same billing customer, the model should state whether the account link overrides the user link, and if a workspace changes ownership, the model should preserve both the prior and current relationship. The identity model also needs time awareness, since a user who joined an account after an experiment ended should not receive historical exposure through that account, and temporal joins protect revenue analysis and post-period retention calculations.
Metric definitions create a shared language
A metric definition should be written as code and reviewed like code. dbt models, MetricFlow, LookML, Cube semantic layer definitions, and warehouse-native SQL models can serve this role. The team should stop defining experiment metrics in one-off dashboard filters.
Each metric needs seven fields:
- Business definition
- SQL definition
- Grain
- Source tables
- Filters and exclusions
- Freshness target
- Owner
For example, trial_to_paid_conversion_rate should specify whether the denominator includes self-serve trials, sales-assisted trials, internal test accounts, reactivated accounts, and trials created through partner channels. These exclusions change the number, and in one B2B funnel, excluding sales-assisted trials reduced reported conversion from 11.8% to 7.4%. Guardrail metrics need the same discipline, since refund rate, support contact rate, latency, error rate, gross margin, and cancellation rate often decide whether a variant ships, and a primary metric lift has limited value if the guardrails use inconsistent windows or grains.
Metric definitions should also name the observation window, because a 7-day activation metric and a 30-day activation metric answer different questions, and readouts become cleaner when the metric name includes the window or the registry records it. The registry should mark each metric as primary, guardrail, diagnostic, or health, where primary metrics drive the decision, guardrails prevent harmful launches, and diagnostic metrics explain behavior after the decision rule is applied.
Finance, product, and analytics should review revenue metrics together, because revenue recognition, refunds, credits, sales-assisted contracts, and annual prepayments affect product metrics, and a single SQL model cannot replace business alignment on these rules. Metric definitions should include known exclusions, since internal employee accounts, QA tenants, fraud rings, migrated customers, and partner-imported users can distort experiment findings, and the registry should record whether each metric excludes those populations. Freshness also matters. A metric that updates daily cannot support a two-hour launch decision, so the experiment brief should match decision timing to the latency of the underlying data.
Validation pipelines catch telemetry failures before readout
Validation must run before, during, and after experiments. Event volume checks catch missing instrumentation, schema checks catch payload drift, identity checks catch join failures, and metric reconciliation catches divergence between warehouse and product analytics tools. A minimal validation suite can run daily in dbt tests, Great Expectations, Monte Carlo, Bigeye, or custom SQL. It should flag changes in event volume above 20%, null identity fields above 2%, duplicate event IDs above 0.5%, and metric movement that conflicts across source systems, and these thresholds are starting points. Mature teams tune thresholds by event criticality and traffic volume, since a billing event with 5,000 daily records needs stricter checks than a hover interaction with 50 million daily records, and the validation policy should reflect business risk rather than event volume alone.
Validation should create alerts with owners. An alert routed to a shared channel without assignment becomes background noise within two weeks, so each failed check needs a named owner, severity, expected response time, and incident record. Validation also needs pre-launch dry runs, where before an experiment opens to traffic the team triggers each event in staging and production-like environments and verifies payload fields, timestamps, identity joins, and metric inclusion. Post-launch checks should run during the first 24 hours, because early traffic can reveal missing mobile payloads, consent-mode gaps, or regional routing issues, and a same-day stop protects the rest of the experiment window.
Validation should also compare expected and actual assignment counts. If a 50/50 split returns 61/39 after 10,000 exposures, the team needs to inspect targeting rules, cache behavior, and eligibility filters, since a sample ratio mismatch can invalidate the treatment comparison. Warehouse reconciliation belongs in the same suite, because product analytics tools and warehouse models can diverge from ingestion delays, timezone rules, bot filters, or late-arriving events, and the readiness process should define which source governs the readout.
The telemetry readiness framework
Engineering leaders need a clear gate before experiment launch. The Telemetry Readiness Framework gives product, growth, analytics, and engineering teams a shared artifact, and the artifact should sit inside the experiment brief or launch checklist.
| Gate | Pass condition | Owner | Evidence |
|---|---|---|---|
| Event contract | All experiment events have approved names, trigger rules, required fields, and schema versions | Product + Engineering | Versioned event spec in Git or tracking plan |
| Identity stitching | Anonymous, user, account, and billing identifiers have defined join rules | Data Engineering | Identity model test with sample users across devices |
| Metric registry | Primary, guardrail, and diagnostic metrics have owners and SQL definitions | Analytics | Metric definitions reviewed in dbt, LookML, or semantic layer |
| Data validation | Event volume, schema, null rate, duplicate rate, and freshness checks run daily | Data Engineering | Automated test results and alert routing |
| Experiment audit | Variant exposure, assignment, and metric windows are verified before launch | Growth + Analytics | Pre-launch audit record |
A team should not launch a controlled experiment until all five gates pass. Exceptions should be documented in the experiment brief with the expected measurement risk, naming the specific metric affected and the decision it can distort. This framework also protects roadmap quality, because if an experiment cannot pass the readiness gate, the team has found a product analytics defect before it affects decisions, and finding that defect before launch is cheaper than explaining it after an executive readout. The framework works because it assigns evidence to each gate. A meeting note does not prove identity stitching, but a passing test with sample users across devices does.
The gate should be lightweight enough to use weekly. A readiness record can be a GitHub issue, Jira ticket, LaunchDarkly checklist, or experiment brief section, and the format matters less than the evidence and owner assignment. For high-risk experiments, add a finance or legal reviewer, because pricing, billing, policy, and regulated workflow tests carry higher decision risk and deserve stronger evidence before launch. The gate should also define expiration, since a readiness record from six months ago should not cover a new pricing experiment after checkout, billing, or consent flows have changed, and teams should revalidate contracts and metrics when the product surface changes.
The framework creates useful friction. It slows only the experiments that lack measurement evidence, and it accelerates decisions after launch because readouts begin from agreed definitions and tested telemetry.
Instrumentation ownership must be explicit
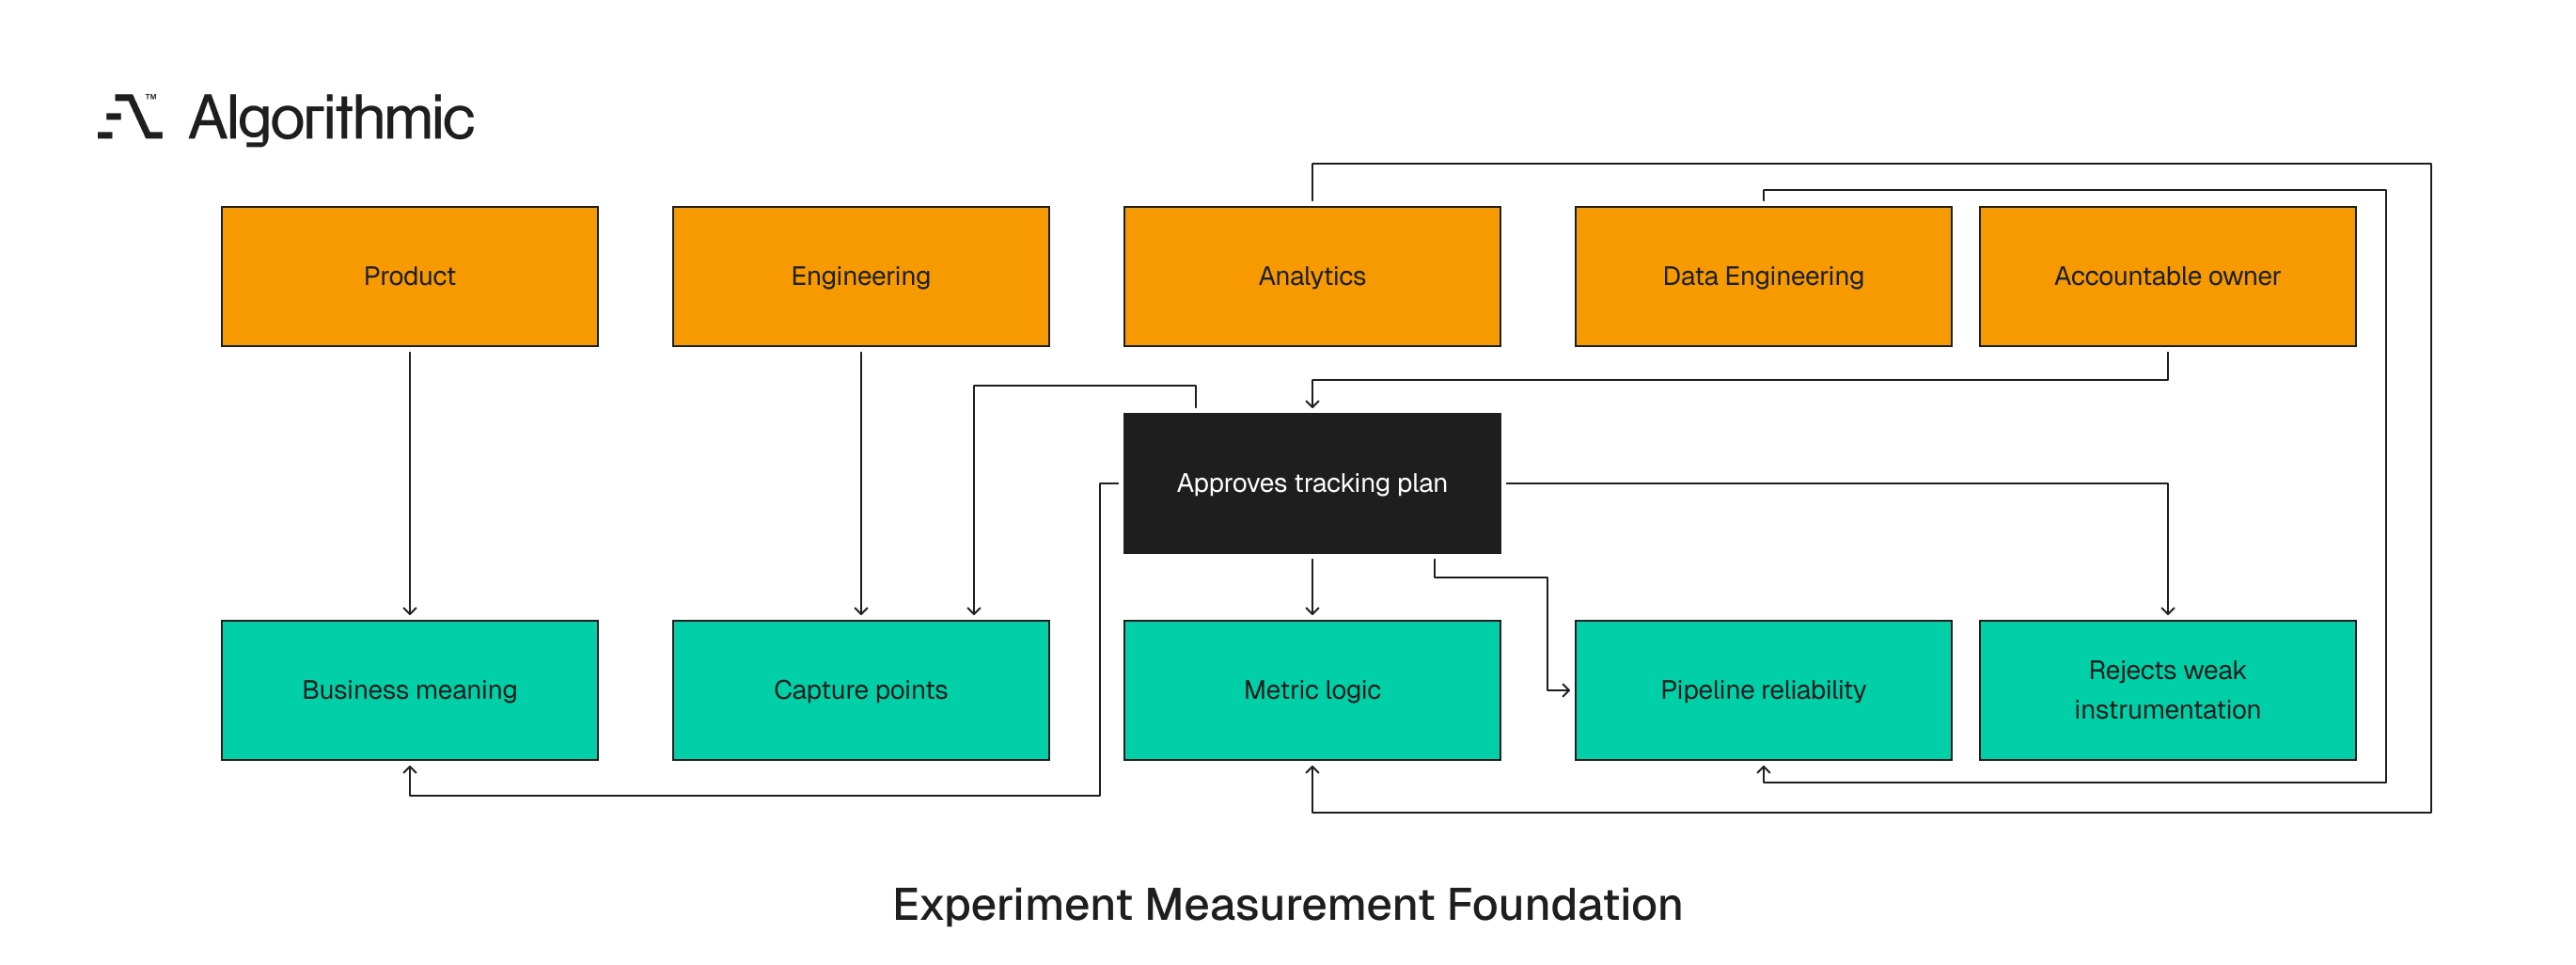
Instrumentation fails when ownership is split across product, analytics, and engineering without a named decision maker. Product defines business meaning, engineering controls capture points, analytics defines metrics and validates readouts, and data engineering owns pipeline reliability.
 Click to expand
 All four roles are required, and one accountable owner should approve the tracking plan for each product area with authority to reject event names, payload fields, and metric definitions before code ships. In a 50-person company, this may be a senior full-stack engineer paired with a product lead and an analytics engineer, while in a 500-person company it may be a product analytics platform team that owns SDK wrappers, event contracts, identity tables, and semantic metrics. The structure changes with size, but the accountability requirement stays constant. Assigning instrumentation entirely to junior engineers through ticket comments creates durable risk, because the decisions affect revenue reporting, roadmap sequencing, customer segmentation, and ML training data, and senior engineers and product leaders need to review the taxonomy before code ships.
Across 35 complex engineering engagements, we have seen the same pattern, where early schema and identity decisions set the cost of every later analytics request. Retrofitting identity stitching after 12 months of event collection is materially harder than designing it during the first instrumentation sprint, and the difference appears in backfills, support tickets, dashboard rewrites, and delayed product decisions. The same trust problem shows up in search relevance testing, where two answers to the same question only reconcile once the metric and the test agree on what a good outcome means.
A practical ownership model uses a RACI matrix. Product is responsible for business meaning, engineering for capture code, analytics for metric logic, and data engineering for pipeline tests, while the accountable owner approves the final tracking plan. Ownership should extend to deprecation, so when a metric or event changes, the owner should approve the migration plan and archive date, or old dashboards and notebooks keep using outdated definitions. The owner should also control exceptions, and if an experiment launches with a known telemetry gap, the owner should record the risk in plain language, stating which decision remains trustworthy and which does not.
Ownership also requires review cadence. A monthly instrumentation review is enough for many teams running fewer than 10 experiments per quarter, while teams running weekly experiments need a standing review tied to release planning. The review should include recent telemetry incidents, event changes, metric definition changes, and upcoming experiment needs, and the agenda should be operational, with owners and dates. A taxonomy discussion without code changes or registry updates does not change production behavior.
The economics favor foundation work
A small instrumentation investment prevents large decision costs, and the math is straightforward, since the most expensive failure is a roadmap decision made from invalid measurement. Consider a B2B SaaS company with 250,000 monthly active users, 18,000 monthly trials, and a 7.2% trial-to-paid conversion rate. The growth team runs two experiments per month, and each one consumes product management time, design time, engineering time, analytics time, and opportunity cost from delayed roadmap work. If each experiment costs 120 team-hours and the blended cost is $125 per hour, each test costs $15,000 before infrastructure and management time, so four invalid experiments cost $60,000, and the larger cost is the roadmap work selected from incorrect results.
Now add an identity defect where anonymous-to-authenticated stitching misses 11% of conversions that occur on another device. The team sees lower conversion for onboarding changes that increase cross-device completion, so the roadmap favors interface changes over account activation work. Engineers spend a quarter on lower-yield UI changes while sales and customer success keep reporting friction during account setup.
A two-to-four-week foundation with one senior engineer, one analytics engineer, and one product lead may cost $25,000 to $50,000 in internal time or external support. That investment can prevent one quarter of misdirected experimentation, especially in teams running 10 or more tests per quarter, and the payback often comes from avoiding one invalid roadmap bet. The same economics apply to analytics system development, because the cost of computing funnels, cohorts, and retention queries rises when event definitions change retroactively, and a product analytics system handling 100 million events per day needs event design discipline before it scales.
There is also a people cost. Analysts become translators for inconsistent telemetry instead of partners in decision design, engineers lose confidence in dashboards and start building private queries, and executives receive conflicting numbers and defer decisions. The financial case strengthens as experiment volume increases, since a team running two tests per month can tolerate more manual review than a team running 20, and once experiment volume reaches double digits per quarter, instrumentation defects become a portfolio risk. The cost also accumulates in the warehouse, where duplicate events, late-arriving facts, and inconsistent grains increase model complexity and query cost, so teams spend cloud budget to process ambiguity they could have removed at capture time.
The economics worsen when a false positive reaches production. A variant that appears to lift conversion can change onboarding, pricing, or billing behavior for the full customer base, and reversing that decision consumes release capacity and creates customer confusion. False negatives carry a quieter cost, because a strong product change can be rejected when telemetry missed conversions, retention, or expansion, and the company leaves value in the backlog while competitors ship comparable improvements.
AI products raise the cost of weak instrumentation
AI product development adds another dependency, labels. Recommendation systems, search ranking models, churn models, and AI agents depend on behavioral signals that come from instrumentation, so weak labels create weak models. If successful_task_completion is defined inconsistently across product surfaces, a model trained on that label learns noise, if user identity is fragmented, personalization systems undercount history, and if guardrail metrics are missing, an AI feature can increase engagement and also increase refunds, support contacts, or policy violations. Measurement systems shape what later models treat as truth, and the same applies to retrieval augmented generation, recommendation engines, and predictive analytics development, since models inherit the labels, windows, and exclusions built into the measurement system.
Agent-based workflows add further pressure, because experimental harnesses, execution logs, tool calls, and evaluation traces must be captured before teams compare model behavior. For ML systems in production, the first AI investment should often be logging, labels, and analytics, since model quality depends on the signal captured before training begins, and teams that skip this step spend later cycles debating whether the model failed or the label was defective.
AI products also need guardrails with operational meaning. A support agent should track resolution rate, escalation rate, refund rate, hallucination flags, customer sentiment, and human review outcomes, and a recommendation model should track click-through, conversion, returns, margin, and long-term retention. These metrics require consistent identity and event timing, so if a customer clicks a recommendation on mobile and returns the product through a web account six days later, the system must connect both actions, or the model receives incomplete feedback.
AI agents increase the need for trace-level observability. A single user outcome may involve a prompt, retrieval query, tool call, external API response, policy filter, and human escalation, and each step needs a timestamp, identifier, outcome, and error state. Evaluation data also needs version control, so model version, prompt version, retrieval index version, and policy version should be recorded with each experiment, or teams cannot reproduce a model comparison after the system changes.
AI systems also magnify historical measurement choices. If the product once captured task completion on web and satisfaction on mobile, a training set can encode surface-specific bias, and the model then learns product instrumentation differences alongside customer behavior. The same concern applies to human feedback, since thumbs-up ratings, review queues, escalation tags, and safety labels require precise definitions, and a support reviewer and a policy reviewer may classify the same conversation differently unless the taxonomy states the rule. Production AI teams need experiment records that connect behavior, model state, and business outcomes, including prompt version, model version, tool configuration, retrieval corpus, guardrail policy, and evaluation dataset, because without that record rollback analysis becomes guesswork.
A 30-day plan before scaling experimentation
Product and analytics leaders should run a telemetry audit before increasing experiment volume or buying a new A/B testing platform. The audit should produce code, contracts, tests, and decision rules, and a slide deck is insufficient. Use this 30-day sequence.
Days 1 to 5 map the decision metrics
List the next 10 planned experiments, and for each one define the primary metric, guardrail metrics, diagnostic metrics, exposure event, conversion window, and decision rule, then record the expected direction of movement. This exercise reveals missing metrics before the team writes experiment code and prevents metric changes after readout, and the output should be a table that product, analytics, and engineering can review together.
Include the minimum detectable effect for each experiment, since a pricing test may need a 3% revenue movement to justify launch while a copy change on a high-traffic landing page may need a smaller threshold and shorter readout window. Add the business decision tied to each experiment, because a metric without a decision rule invites post-readout debate, and the brief should state whether the team will ship, stop, iterate, or rerun based on defined outcomes. The table should also name the grain of the decision, since user-level activation, account-level expansion, and session-level click-through require different exposure logic, and recording the grain early prevents incompatible analysis later.
Days 6 to 12 review event capture against product flows
Trace the product flows connected to those experiments. Confirm where events fire, which service emits them, which identifiers are present, and how retries or duplicate submissions are handled, then compare the intended event contract with observed production payloads. Backend events should be preferred for revenue, account creation, entitlement changes, and workflow completion, frontend events are better suited for interaction behavior and UI diagnostics, and webhooks should be checked for delay, retry behavior, and idempotency.
For each event, inspect at least 100 recent payloads and look for missing identifiers, unexpected nulls, invalid enum values, timestamp drift, and duplicate event IDs, since these defects appear quickly in raw data. Review client version coverage during this step, because mobile apps, browser extensions, and desktop clients can lag the latest contract by weeks, and the experiment plan should state which client versions are included or excluded. This review should include failure paths, since payment failure, invitation expiration, account cancellation, refund issuance, and permission denial often lack consistent events, and guardrail metrics depend on these paths as much as success metrics do. Engineers should inspect the code path for each event and confirm whether it fires before or after the database transaction, external API response, or queue acknowledgement, because that timing determines what the event can prove.
Days 13 to 18 validate identity stitching
Select 50 real users across web, mobile, multiple devices, workspace accounts, and billing records, including at least 10 accounts with multiple users, then confirm that the identity model connects their events correctly. This sample will find defects that aggregate dashboards hide and expose account-level and user-level metric confusion, since a small manual sample often finds failure modes before automated tests are written. Document every failed join and classify each failure by source, whether missing identifier, delayed merge, duplicate account, billing mismatch, or privacy restriction, because the classification tells engineering where to fix the system.
Add synthetic users for repeatable testing, with known journeys that cover anonymous browsing, signup, invitation, purchase, cancellation, and reactivation, since these records become regression tests for the identity model. Include time-based tests, because a user invited to an account after exposure should not inherit earlier variant assignment, and a billing account merged after conversion should preserve the original conversion date and source. The audit should also test deletion and suppression behavior, so remove or suppress a synthetic user and confirm that analytical tables, identity links, and experiment samples reflect the rule, since privacy controls affect measurement and the readout should show the effect.
Days 19 to 24 create the metric registry
Define the top 15 product and growth metrics in SQL or a semantic layer, assign owners and freshness targets, and add exclusions for internal accounts, test data, fraud, refunds, and imported customers. The registry should become the source used by dashboards, experiment reports, and executive metrics, so each dashboard should reference registry metrics instead of local calculated fields, which reduces metric drift across teams. Review the registry with finance for revenue metrics and customer success for retention metrics, because finance often owns billing definitions that product teams miss and customer success often knows which accounts should be excluded from churn analysis.
Tag each metric by approved use, since some metrics support daily monitoring while others support experiment readouts or board reporting, and the registry should prevent a diagnostic metric from becoming a company-level target without review. Add examples to the registry, with two or three sample rows per metric that show included and excluded records, because examples reduce interpretation errors during future analysis. The registry should also record upstream dependencies, so if paid_conversion_rate depends on Stripe invoices, Salesforce opportunities, and warehouse account status, the definition should name each source, which helps teams assess incident scope when one source changes.
Days 25 to 30 add validation and launch gates
Set up automated checks for event volume, schema changes, null identity fields, duplicate event IDs, freshness, and metric reconciliation, add the Telemetry Readiness Framework to the experiment launch process, and route each alert to a named owner. No experiment should launch without a signed readiness record, a small control with large downstream value that should include the event contract version, metric registry links, validation status, and known measurement risks. Run the readiness process on one planned experiment before applying it broadly, since the first pass will expose gaps in ownership, tooling, and review cadence that teams should fix before running the next 10 experiments.
Schedule the first post-launch review before traffic starts, within 24 hours of launch and again at the first metric window, since this cadence catches telemetry defects while the experiment can still be paused. The launch gate should also define stop conditions such as assignment imbalance, missing conversion events, identity null rates above threshold, or warehouse freshness outside the decision window, because stop conditions give teams authority to pause without debate. After the first experiment, hold a 30-minute retrospective on the readiness process and record which checks caught defects, which checks created noise, and which owners missed response targets, since the process should improve as the experiment program grows.
Start with the measurement system
Experimentation programs create value when teams can trust the behavior they measure. Event capture, identity stitching, metric definitions, and validation pipelines form the foundation, and without it experiment reports become arguments about telemetry. Before launching the next A/B test, run a 30-day telemetry audit against the next 10 planned experiments and fix the event contracts, identity model, metric registry, and validation checks before scaling the program, because the work costs weeks and the avoided rework often saves a quarter.
The sequence is straightforward. Define the decision, verify the events, test the identity model, codify the metrics, and set validation gates, and teams that complete this work enter experimentation with evidence instead of optimism. Instrumentation is the measurement system for product judgment, so treat it with the same seriousness as production infrastructure, release safety, and financial reporting, and start the experiment roadmap only after the telemetry can support the decisions it is expected to produce.
Algorithmic builds the data infrastructure and integrations that make event capture, identity resolution, and metric definitions trustworthy before a team scales experimentation. Start a conversation if your A/B tests are producing numbers the team cannot fully trust.