

A $40 million ARR SaaS company can spend $250,000 on executive dashboard development and still enter the board meeting with four revenue numbers. The dashboard loads in two seconds, the SQL runs without error, and the BI tool has the correct permissions, filters, and visual design. The board still loses confidence, because Sales, Finance, Product, and Customer Success define the same metric four different ways.
Finance counts revenue from invoices, Sales counts signed contracts, and Product counts activation after first use. Customer Success counts activation after onboarding completion. Each definition has operating value, yet executive reporting needs one governed definition for every board-level metric. Without that definition the dashboard becomes a polished interface for unresolved disagreement, and the failure that sits inside the operating model surfaces in the boardroom.
Analysts have tracked this adoption gap for years, and BI and analytics adoption stays low even after companies fund tools, infrastructure, and analyst time. The pattern repeats across mid-market SaaS, marketplaces, healthcare platforms, and financial services firms, where companies fund visualization before they define the metrics executives must trust. Leadership then uses quarterly business reviews to reconcile numbers, the meeting becomes an accounting exercise, and hiring, pricing, churn response, and product investment all wait for a cleaner number.
The cost rarely appears in the dashboard budget. It shows up as delayed decisions, reworked analysis, duplicated reporting, and lower trust in the data team, and that accounting blind spot makes the failure easy to repeat. A company approves another dashboard project and carries the same metric disagreement into the next cycle.
Executive dashboard development should start with canonical metrics. The work requires named owners, written contracts, certified datasets, data quality checks, and a metric layer that prevents local redefinition. Chart design comes after that control system exists, because a dashboard without metric control only gives executives faster access to disputed numbers.
Metric disagreement turns reporting into reconciliation work
Executive dashboards exist to compress decision time. A CEO should know whether net revenue retention fell because expansion slowed, churn increased, discounting changed, or reporting rules changed. A CFO should know whether pipeline coverage supports the next two quarters of bookings, and a CTO should know whether latency, defect rates, and incident volume threaten renewal risk. A Chief Customer Officer should know which accounts need executive intervention before the next renewal cycle, and every one of those decisions requires shared definitions before the first chart is built.
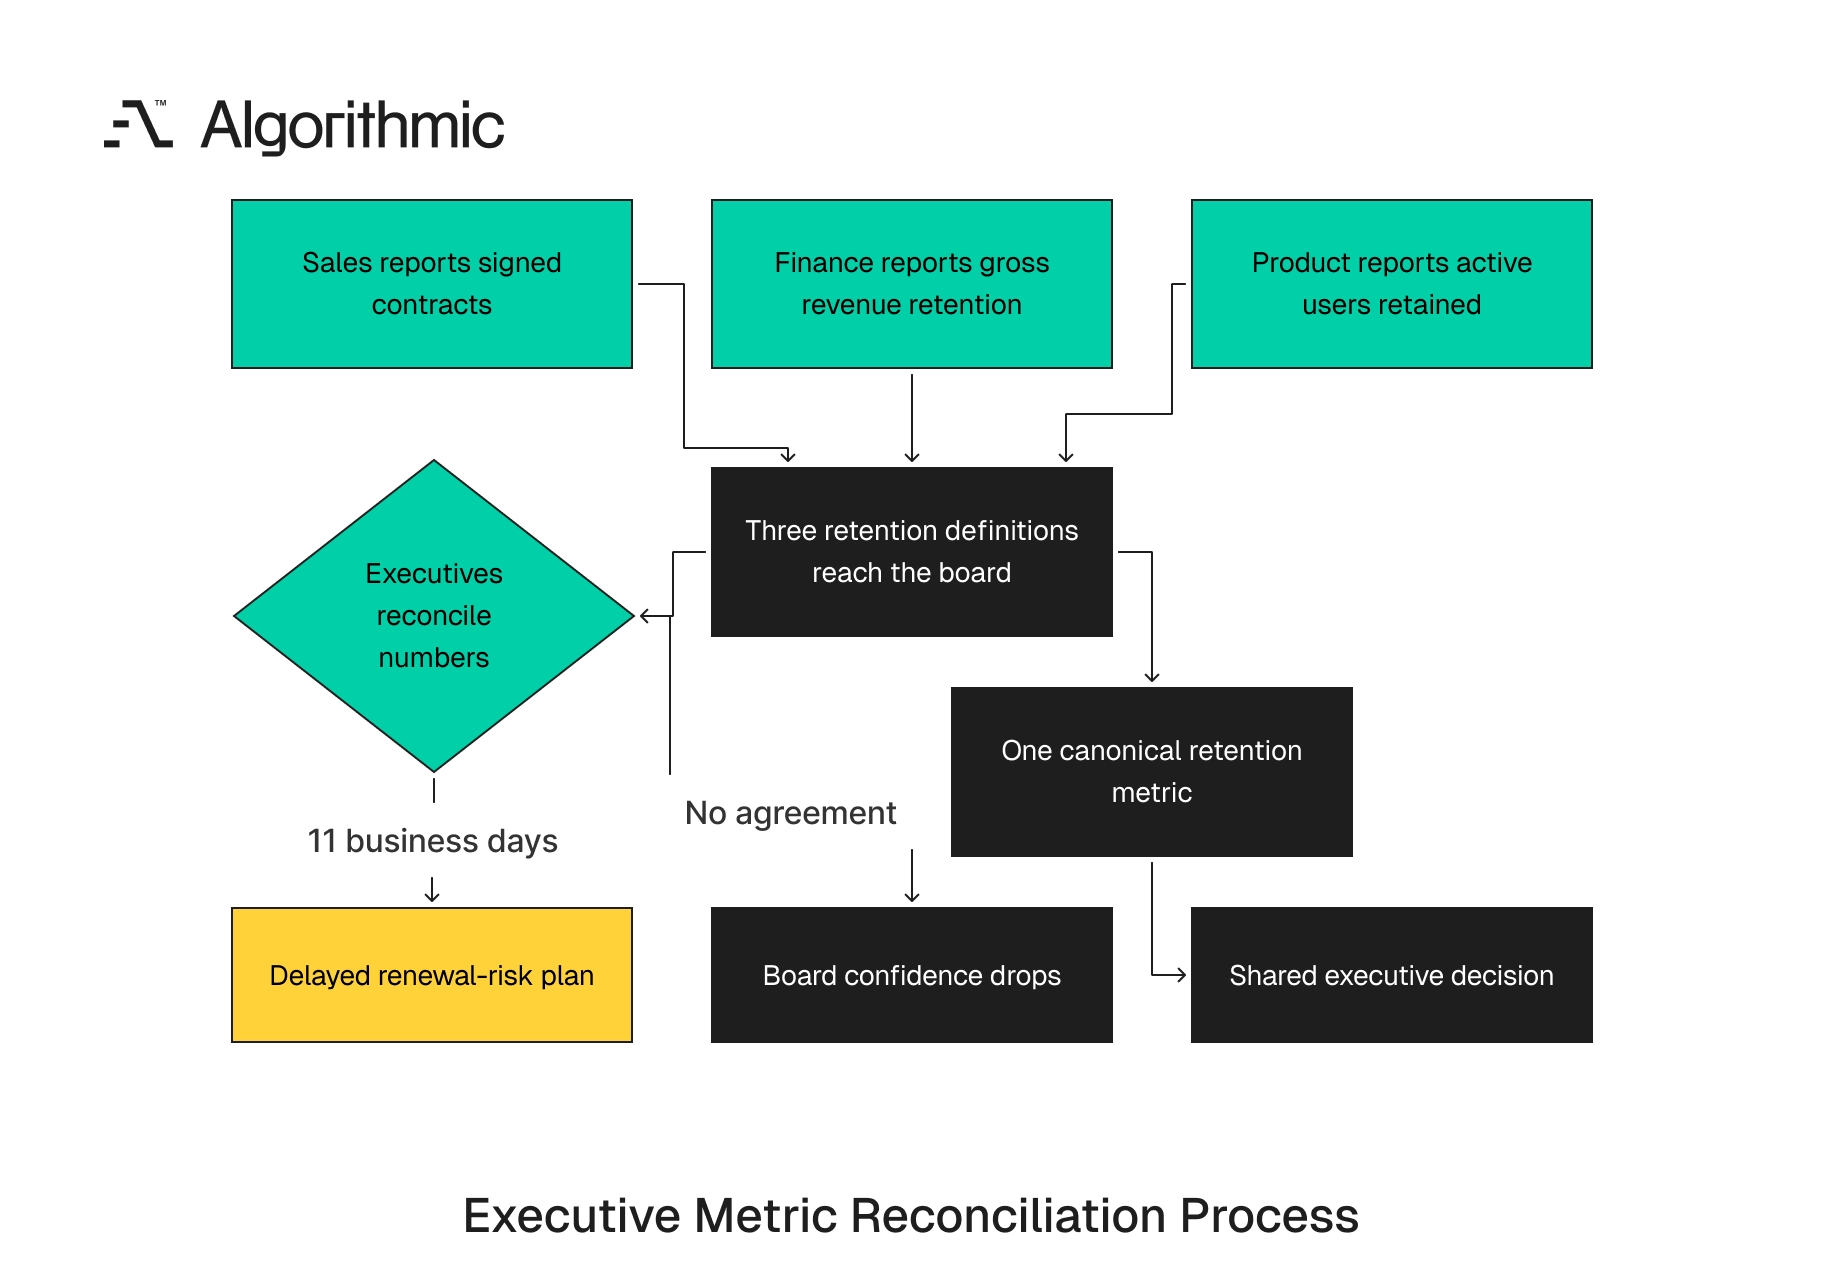
In one B2B software company with 180 employees, three teams reported retention in the same executive meeting. Finance reported gross revenue retention at account grain, Customer Success reported logo retention after excluding customers below $5,000 ARR, and Product reported retained active users based on 30-day usage. All three numbers were technically valid, and the executive team spent 11 business days reconciling definitions before approving the renewal-risk plan.
 Click to expand
 That pattern is commercial waste. A quarterly business review with 12 executives and four analytics staff can consume 60 to 80 person-hours in one meeting cycle, and if the meeting ends with requests for reconciled numbers, another 40 to 120 hours move into follow-up analysis that interrupts roadmap planning, pricing work, churn review, and sales capacity planning. The decision delay often costs more than analyst time, since a delayed churn plan can leave hundreds of thousands of dollars in renewal risk unmanaged for another month, and a delayed pricing decision can defer revenue changes across an entire sales cycle. For an enterprise SaaS company with 45-day sales cycles, one missed pricing window can affect an entire quarter.
Harvard Business Review’s analysis of where data-driven decision making goes wrong points at the same failure, where leaders act on numbers whose definitions they never agreed on. The operating requirement is specific, since executive dashboards need canonical metrics with named owners, versioned definitions, and governed consumption paths. Those controls turn reporting from debate into management.
A dashboard that fails a metric challenge in the boardroom is unfinished. The failure begins before a designer opens Tableau, Power BI, Looker, Sigma, or Mode, and it begins when teams treat definitions as local preferences, so the same word appears in four reports and carries four operating meanings. This is the recurring executive failure mode, where teams build a dashboard before they build a metric operating model, and the result looks finished to the sponsor while it stays unfit for board reporting.
A production-ready executive dashboard needs the same discipline as a production service. It needs ownership, interfaces, tests, releases, and incident paths, because without those controls every refresh can create a new dispute and the dashboard becomes another system requiring executive interpretation before it can support executive action.
A technically correct dashboard can still be commercially useless
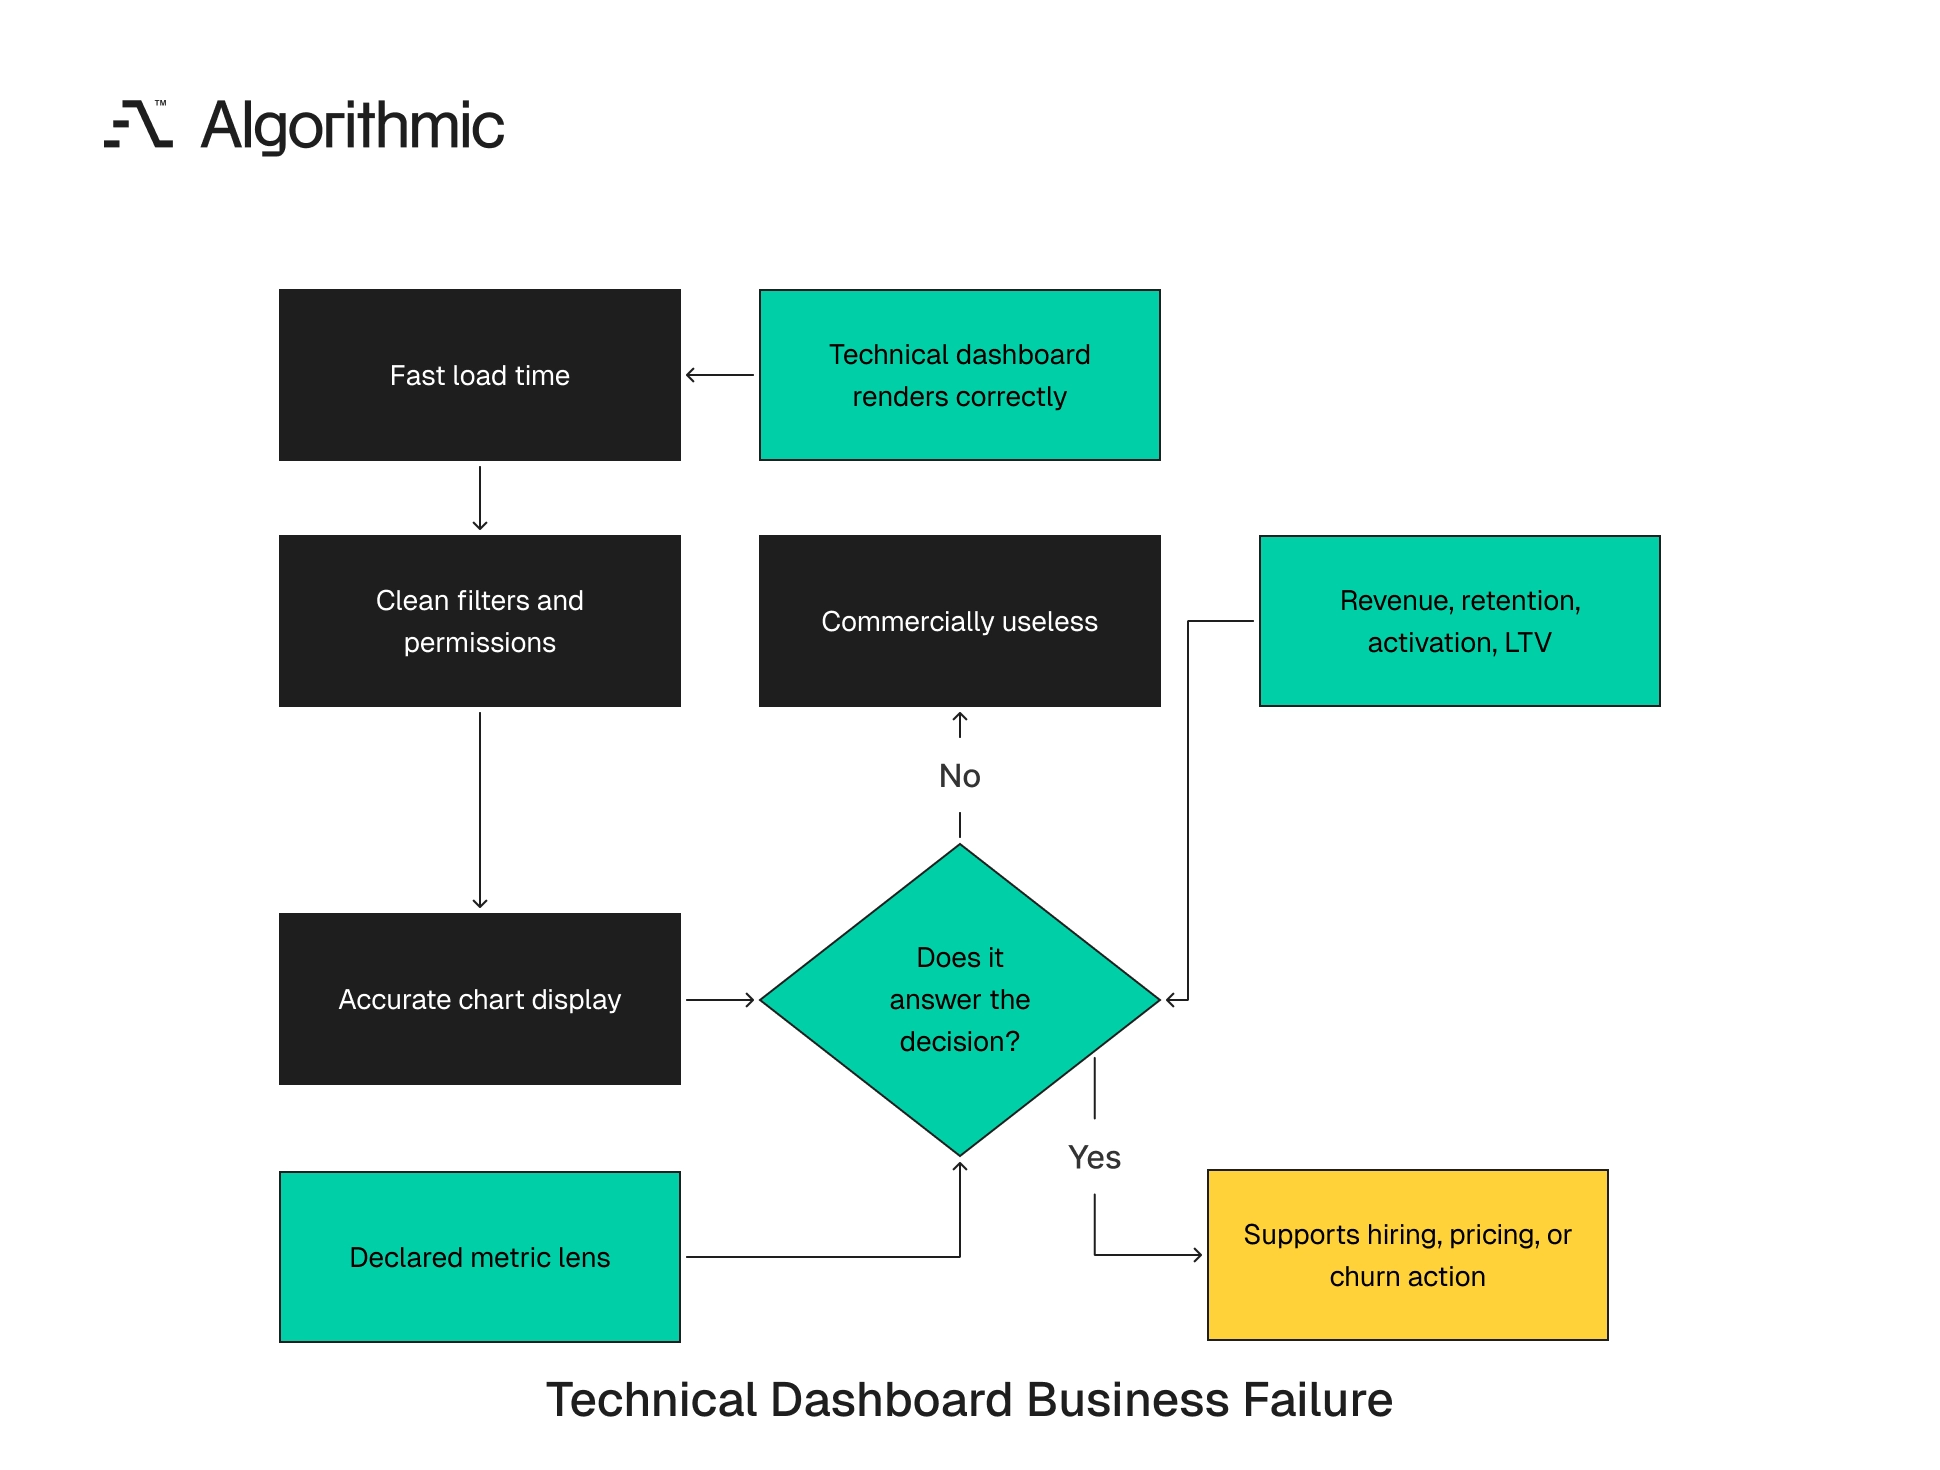
A dashboard is technically correct when the pipeline runs, transformations match the written SQL, and the visualization displays the query result accurately. Commercial usefulness requires a stronger test, since the metric must answer the decision question leadership is asking. Fast rendering and clean formatting cannot make up for a metric that answers the wrong question.
Revenue, retention, activation, and LTV create the most failures because each crosses several functions and each function has a legitimate operating lens. Executive reporting needs a declared lens for each decision, and that declared lens must be written, owned, tested, and visible from the dashboard. The distinction matters in production, because a weekly executive meeting cannot spend 20 minutes debating whether a chart uses signed ARR or recognized revenue. That meeting should decide whether to adjust hiring, pricing, product investment, or customer intervention, yet metric disputes consume the exact time the dashboard was built to save.
 Click to expand
 Revenue fails when timing rules differ
Revenue can mean booked ARR, recognized revenue, invoiced revenue, collected cash, gross merchandise value, or net revenue after refunds. A marketplace platform may track gross transaction value for growth while it tracks net revenue for Finance and contribution margin for operating decisions, and those metrics answer different executive questions. Booked ARR measures commercial commitment, recognized revenue measures accounting performance, cash collections measure liquidity, and contribution margin measures operating quality, so each metric belongs in a specific decision context with a specific owner.
The executive dashboard must label each metric precisely, because “revenue” is too broad for board reporting. A label like “recognized subscription revenue, monthly, net of credits, excluding services” gives Finance and analytics a governable definition, since it states the timing, scope, and exclusions.
Timing rules create the most common conflict. Sales may count a $600,000 annual contract on the signature date, Finance may recognize $50,000 per month under the ASC 606 revenue standard, and Customer Success may include the account only after implementation. A single chart cannot reconcile those definitions through improved visual design, so precise labels, controlled definitions, and separate decision contexts resolve the reporting conflict. A board pack should distinguish booked ARR, recognized revenue, cash collections, and renewal ARR, because combining them under “revenue” creates a predictable dispute that then moves from the data team into the board meeting.
The same problem appears in usage-based businesses. A cloud infrastructure company may report committed spend, consumed usage, invoiced usage, and collected cash, and the executive dashboard must state which measure drives sales planning, liquidity review, and investor reporting, since those three uses require different rules and different refresh expectations.
Retention fails when the entity and denominator differ
Retention changes meaning based on the entity counted. Logo retention answers whether customers remain, gross revenue retention answers whether retained customers kept their contracted spend, net revenue retention adds expansion and contraction, and user retention measures usage behavior inside the product. Each metric has a valid purpose and a distinct executive use.
Executive reporting must assign a primary retention metric for each decision type. A SaaS board pack may use net revenue retention for enterprise value, gross revenue retention for churn control, and 90-day active account retention for product adoption, so the dashboard should separate those measures across named sections because one retention chart cannot carry all three decisions.
The denominator matters as much as the numerator. A retention metric based on beginning-period ARR produces a different result from one based on active accounts, and a retention metric excluding customers below $5,000 ARR produces a different view from a full-base metric. Both results may be legitimate, so the dashboard must state which one governs.
Account hierarchy creates another failure point, since a parent company with four subsidiaries can appear as one retained logo or four separate logos. The canonical definition must state the account hierarchy rule before the number reaches executives, otherwise Sales, Finance, and Customer Success will reconcile hierarchy rules during review. Renewal timing also changes the result, because a customer with an annual contract up for renewal in June should not be treated like a monthly customer, and the retention metric must define period eligibility and renewal exposure so churn does not appear to move because the calendar changed.
Activation fails when onboarding and value are conflated
Product teams often use “activated” to mean account created, first login completed, first workflow run, or first successful business outcome, and those events differ materially. Account creation measures acquisition completion, first value measures product adoption, and repeat behavior measures habit. A stronger definition separates three concepts:
- Onboarded, where the customer completed the first-time promise, such as importing data and inviting the first user.
- Goal events, where repeat actions show habit, such as a second workflow run or fifth report exported.
- North Star metric, the customer-defined value measure proven to correlate with retention, such as time-to-value under seven days.
Conflating these concepts hides the operating issue, because the company may have an acquisition problem, an onboarding problem, a product value problem, or a retention problem, and each requires a different executive decision. Acquisition requires channel or messaging work, and onboarding requires implementation, product flow, or customer education work. A cybersecurity SaaS company may define activation as first monitored asset connected within seven days, while a collaboration product may define it as three team members completing two shared workflows within 14 days. The correct definition depends on the behavior tied to renewal and expansion, and the evidence should come from cohort analysis, renewal analysis, and product telemetry.
The definition also needs an instrumentation standard, so product events should have stable names, required properties, and schema checks. A renamed property can make activation fall 30% overnight without any product change, and the dashboard then reports an instrumentation defect as a business event. Executive dashboards should show activation only after Product and analytics agree on the event contract, covering event name, trigger condition, timestamp source, account mapping, and duplicate handling. Without that contract, activation becomes a chart over telemetry noise, and the team spends executive time explaining tracking changes instead of customer behavior.
LTV fails when margin, churn, and cohort rules change
Lifetime value is sensitive to gross margin, churn period, expansion assumptions, discounting, and cohort selection. Finance may calculate LTV using gross margin and monthly churn, Growth may use revenue-based LTV without service cost, and Product may use cohort-level predicted LTV from behavioral signals. These formulas serve different purposes, so a board dashboard should publish one approved formula for each decision context.
An executive dashboard should publish LTV after the formula is documented and owned, and the definition must state entity, time window, margin treatment, expansion treatment, and exclusion rules. It should also state whether the metric uses historical cohorts or modeled future behavior, since a modeled number should carry confidence bands and a model version. CAC payback usually has the same problem, because sales expense, marketing expense, implementation cost, channel fees, and gross margin treatment change the result. If leadership uses CAC payback for hiring or channel investment, the formula needs the same discipline as LTV and should reconcile to Finance-controlled expense categories.
A simple LTV formula can support investor reporting, a cohort-based LTV model can support acquisition spend, and a product-led growth model can support onboarding design, so each formula belongs in its own named context. Those formulas should never share one unqualified label, and the dashboard should name them according to purpose, formula, and owner. That naming discipline prevents one metric from absorbing incompatible decisions, and it gives executives a stable reference during board review.
Canonical metrics need ownership, grain, and discoverability
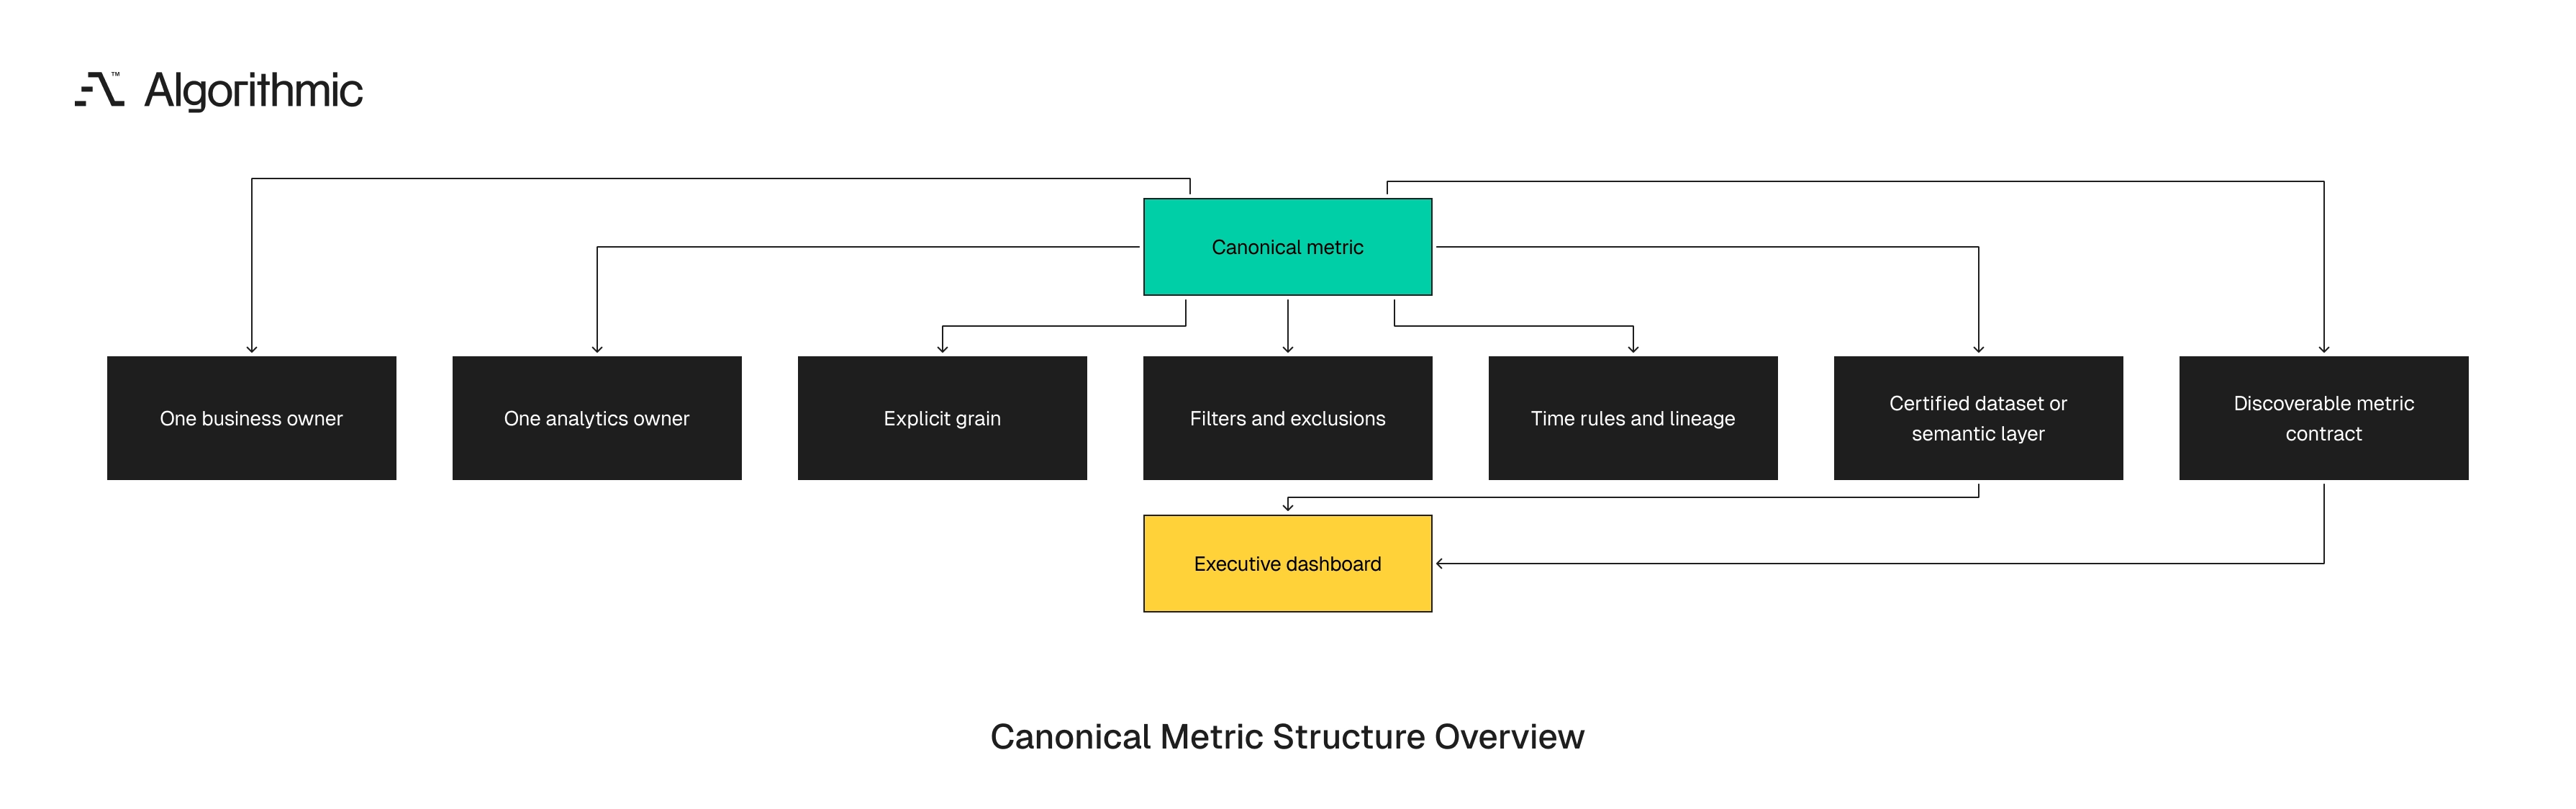
Canonical metrics are approved definitions used across executive reporting and operating dashboards, and they require more than a business glossary. They need ownership, data contracts, lineage, tests, and a controlled path for consumption, because the contract connects business meaning to production code. In production systems, terminology must connect to tables, transformations, dashboards, and access rules, since a definition that lives only in a glossary will not prevent conflicting SQL and analysts under deadline pressure will copy the closest available query.
The operating model matters. A canonical metric must have a business owner who controls meaning and a technical owner who controls implementation, and both owners need authority to reject local variants that break the approved definition. Without that authority, governance becomes documentation without enforcement.
 Click to expand
 One owner per executive metric
Every canonical metric needs one accountable owner. Revenue often belongs to Finance, activation may belong to Product, and net revenue retention may sit with Finance or Customer Success depending on the operating model. Ownership cannot sit across committees for daily decisions, because shared ownership creates unclear escalation when numbers conflict. The owner approves the definition, resolves disputes, and signs off on changes, while analytics leaders maintain the implementation. Business owners should own the meaning, and that separation keeps the data team from making commercial policy decisions through SQL.
A practical rule works well, where no metric appears on the executive dashboard without a named executive owner and an analytics owner. The executive owner controls the definition and the analytics owner controls the data implementation, and both names should appear in the metric contract. The ownership register should include names, approval dates, change dates, and escalation paths, because a metric owned by RevOps or the Finance team is not enough for executive reporting. A named person must have decision rights, and the name matters when a disputed account changes the quarter-end result.
For a worked example, recognized subscription revenue may name the CFO as business owner and the analytics engineering lead as technical owner, while time-to-value under seven days may name the CPO as business owner and the product analytics lead as technical owner. That structure gives executives a direct path when the metric changes. If Finance changes revenue recognition rules after a contract migration, the metric owner approves the change, analytics engineering versions the model and publishes release notes, and the dashboard consumer sees a controlled change instead of a surprise variance.
Grain, filters, and time rules must be explicit
Most metric conflicts come from five technical causes, which are grain, time logic, filters, exclusions, and joins. The same causes appear across SaaS, marketplaces, healthcare platforms, and financial services firms, because operating systems were built for transactions, not executive reporting. Each canonical metric should specify:
- Entity grain, such as account, user, contract, invoice, opportunity, or transaction.
- Time grain, such as daily, weekly, monthly, or quarterly.
- Recognition date, such as signature date, invoice date, service period, payment date, or event date.
- Inclusion rules, such as active customers, paid plans, regions, or product lines.
- Exclusion rules, such as refunds, internal accounts, test data, trials, or cancelled contracts.
- Late-arriving data policy, describing how restatements are handled after close.
- Hierarchy rule, such as parent account, child account, workspace, tenant, or billing entity.
- Currency rule, covering transaction currency, reporting currency, exchange-rate source, and conversion date.
Without these details, teams re-derive private versions and the dashboard becomes a presentation layer over governance debt. The debt compounds every time an analyst copies an old query, since a copied query becomes a new definition once a local filter changes.
Late-arriving data deserves explicit treatment, because billing adjustments, refunds, delayed product events, and CRM stage corrections can change historical numbers. Executives need to know when a period is closed, when restatement is allowed, and who approves a change, and this rule prevents silent changes to prior months. The close policy should be written, so Finance may close monthly ARR on the fifth business day, and after that date restatements require CFO approval and a metric change note that describes the account, amount, rule, and period affected.
Product event data needs the same rule, since a mobile SDK outage can backfill events three days late. The activation metric should state whether those events restate the prior period or appear in the current refresh, because the choice affects trend interpretation and product accountability.
Metrics should be consumed as governed assets
Teams should not copy SQL fragments from old dashboards. Canonical metrics should be exposed through governed tables, dbt models, a semantic layer, or metrics APIs, and the implementation depends on the stack while the principle stays constant, since approved logic should have one controlled consumption path. A Snowflake and dbt environment may publish approved metric models into a mart_executive schema, a Looker environment may define governed measures in LookML, and a Cube, MetricFlow, or dbt Semantic Layer design can centralize metric logic for BI tools and applications. The selected pattern should match team skills and production standards.
Centralized logic gives analysts one approved place to query, and it gives data leaders one place to review formula changes. Discoverability matters, because if teams cannot find the approved definition in under two minutes, they will create a local version under deadline pressure. The data catalog, BI certification labels, and warehouse naming conventions must point to the same approved asset, since inconsistent naming recreates ambiguity inside the tooling.
A practical naming standard helps. Use names such as metric_nrr_monthly_account or mart_executive_arr_monthly instead of generic table names, so the name reveals entity, time grain, and metric purpose, while a table named final_revenue_v3 gives no executive control. The approved asset should also carry metadata that includes owner, definition, source tables, refresh time, last successful test, and change history, and that information should be available from the BI tile or linked documentation so the dashboard consumer never asks Slack for the definition.
Metric consumption must be boring by design. Analysts should reach for the certified model because it is faster, documented, and accepted in review, since if the private path is easier the organization will recreate drift under pressure. Governance works only when the approved path is the practical path.
The canonical metrics readiness matrix
Before funding executive dashboard development or BI modernization, leadership should review the metrics behind the dashboard. The following matrix is a practical artifact for CEOs, CFOs, CTOs, and analytics leaders, since it turns an abstract governance discussion into a reviewable checklist and separates metric readiness from visual design preferences.
| Readiness area | Required standard | Evidence to review | Failure signal |
|---|---|---|---|
| Metric ownership | One executive owner and one analytics owner per metric | Ownership register with names and approval dates | Revenue owned by Finance, Sales, and RevOps jointly |
| Definition precision | Written formula, grain, filters, exclusions, and time rules | Metric contract or glossary entry linked to code | Definition exists only in slide notes or analyst memory |
| Source lineage | Trace from dashboard tile to warehouse tables and source systems | dbt lineage, BI lineage, or data catalog entry | Analysts cannot identify the source table during review |
| Governed access | Teams consume approved tables, semantic layer measures, or APIs | BI model, certified dataset, or metrics service | SQL copied across dashboards with local edits |
| Change control | Versioned changes with approval and effective dates | Architecture decision records or metric change log | Historical charts restate without explanation |
| Data quality monitoring | Automated checks for freshness, volume, nulls, and reconciliation | Great Expectations, Soda, dbt tests, or warehouse checks | Executives find defects during the meeting |
| Decision mapping | Each metric tied to a named executive decision | Dashboard specification or board reporting map | Metrics shown because the data is available |
A metric that fails three or more rows is not ready for executive reporting. The dashboard can still be built, yet it will not support reliable decisions, and the failed rows identify the work required before board exposure. The matrix also gives sponsors a funding control, because if the team asks for dashboard design budget, leadership can request the evidence column first. Missing evidence points to governance work, data modeling work, or source-system repair, and that distinction protects the budget from being consumed by cosmetic work.
This review should take less than two hours for a first pass. A mature data team can populate the evidence column from dbt documentation, BI lineage, and a data catalog, while an immature environment will expose gaps quickly, and those gaps are useful because they show where executive trust will fail. The readiness matrix should be used before vendor selection, since a new BI tool will not repair metric ownership, account hierarchy, or revenue recognition logic. Those decisions belong in the data operating model, and tool selection comes after the metric system has a controlled shape.
Executives should treat failed rows as release blockers for board reporting. A chart can enter internal review before every row passes, yet it should not enter the board pack until the metric passes ownership, lineage, access, and change-control checks, because board reporting demands more discipline than departmental exploration.
The 4-gate framework for dashboard development
Executive dashboard development should pass through four gates before design work starts. This sequence reduces rework, gives analytics teams a clear path from governance to production, and gives executives a basis for acceptance before the dashboard enters board reporting. Acceptance should test whether the dashboard supports decisions, not whether the team can explain definitions.
The gates are sequential. A team that skips the metric contract will pay for that omission during acceptance, a team that skips certified implementation will pay for it during the first metric dispute, and a team that skips executive acceptance will test the dashboard in front of directors.
Gate 1 decision inventory
List the recurring decisions the dashboard must support, such as approving headcount, changing pricing, funding a product line, escalating churn risk, or revising sales capacity. Each decision should connect to a metric, a threshold, and an accountable executive, because the metric exists since the decision exists. A board-level dashboard with 25 charts and no decision inventory is a reporting repository, while a useful executive dashboard often has 8 to 12 primary metrics, each tied to a decision, and the number should stay small enough for weekly or monthly executive review.
The inventory should also define decisions outside scope, since a first release should not attempt to cover every operational question. A narrow decision inventory protects the team from building a dashboard that satisfies no one, and it gives executives a direct way to reject unrelated requests. A practical decision inventory uses plain language, so “approve enterprise sales hiring for Q3” is a decision while “monitor pipeline” is a topic, and the distinction matters because topics expand while decisions have thresholds and owners. The inventory should also name the trigger, so a rule such as “if pipeline coverage falls below 3.0x for two consecutive weeks, the CRO presents a recovery plan” tells the analytics team which metric, cadence, and threshold matter and tells the CRO when the dashboard requires action.
Gate 2 metric contract
A metric contract is a short specification that defines a metric in business and technical language. It should include formula, grain, source systems, owner, refresh cadence, allowable latency, exclusions, and known limits, and it should also state the approved consumption path, which can be a dbt model, a semantic measure, a certified dataset, or a metrics API.
For a worked example, net revenue retention may be defined as beginning-period ARR from active customers plus expansion minus contraction and churn, divided by beginning-period ARR, measured monthly at account grain. It excludes one-time services and customers acquired during the period, Finance owns the definition, and analytics engineering owns the dbt model. That definition is clear enough for Finance to approve and analytics engineering to build, and it gives Customer Success and Sales a fixed reference during reviews. Disputes then move into the change-control process and leave the executive meeting, so the meeting returns to renewal risk and expansion strategy.
A metric contract should fit on one page, because long specifications usually hide unresolved decisions. The contract must be precise enough for code and readable enough for an executive owner, so a CFO should understand it without reading SQL. The contract should include example rows, and for NRR it should include one churned account, one expanded account, one contracted account, and one new account excluded from the period, since examples expose ambiguity faster than prose and a disputed example gives the owner a concrete decision to approve. The contract should also state the failure condition, so if source freshness exceeds 24 hours or reconciliation differs from the accounting system by more than 0.5%, the metric should display a warning that protects executives from silent defects and prevents analysts from defending numbers they know have failed controls.
Gate 3 certified implementation
After approval, the metric should move into a certified implementation. In a modern data stack, this usually means source ingestion through Fivetran or custom connectors, transformation in dbt, storage in Snowflake, BigQuery, Redshift, or Databricks, and publication through a governed semantic model or certified BI dataset. The BI tool does not own the metric definition, since the governed data layer or semantic model should own it, and this separation keeps formulas out of workbooks and spreadsheets while it reduces the number of places a definition can diverge.
Certification should require automated tests. At minimum, teams should test freshness, accepted values, referential integrity, duplicate keys, null rates, and reconciliation, and financial metrics should reconcile against Finance-controlled systems while teams also test row-count variance after source-system releases. For product events, certification should include event schema checks, because a renamed event property can break activation metrics without causing a pipeline failure, so analytics engineering should catch that before the executive dashboard refreshes and a failing schema check should block publication or mark the tile as degraded.
Certification also requires lineage, so a dashboard tile should trace to the semantic measure, dbt model, warehouse table, source object, and system owner. That trace reduces incident time when an executive challenges a variance, and it gives the data team a structured path for root-cause analysis. The certified implementation should include release notes, since a change to account hierarchy, billing treatment, or FX conversion should be visible to dashboard consumers, and silent metric changes destroy trust faster than a temporary data delay because executives accept a known data incident sooner than an unexplained restatement.
Gate 4 executive acceptance
The final gate is executive acceptance, a working session where business owners review metric outputs, compare them with known reference reports, and approve the dashboard for production use. The session should include Finance for financial metrics and Product or Customer Success for adoption and retention metrics. Acceptance should happen before the dashboard is used in a board meeting, since running this process during a quarterly review creates avoidable risk, and the board meeting should test the decision while the acceptance session tests the definition, data, and language.
The acceptance record should state which metrics passed, which exceptions remain, and which numbers require annotation. A retention chart may need a note about migration from monthly to annual billing, and the annotation prevents an avoidable dispute during review while it preserves context for directors who were not in the implementation sessions. Acceptance should include a variance review, so if ARR differs from the Finance workbook, the team should document the cause by account, contract, and rule, because a known variance can be accepted while an unexplained variance should block release.
Executives should also approve dashboard language. Labels such as ARR, active account, and churn need the same precision as the underlying model, since the label is part of the control system and a vague label can reintroduce the ambiguity the metric contract removed.
The architecture pattern that prevents metric drift
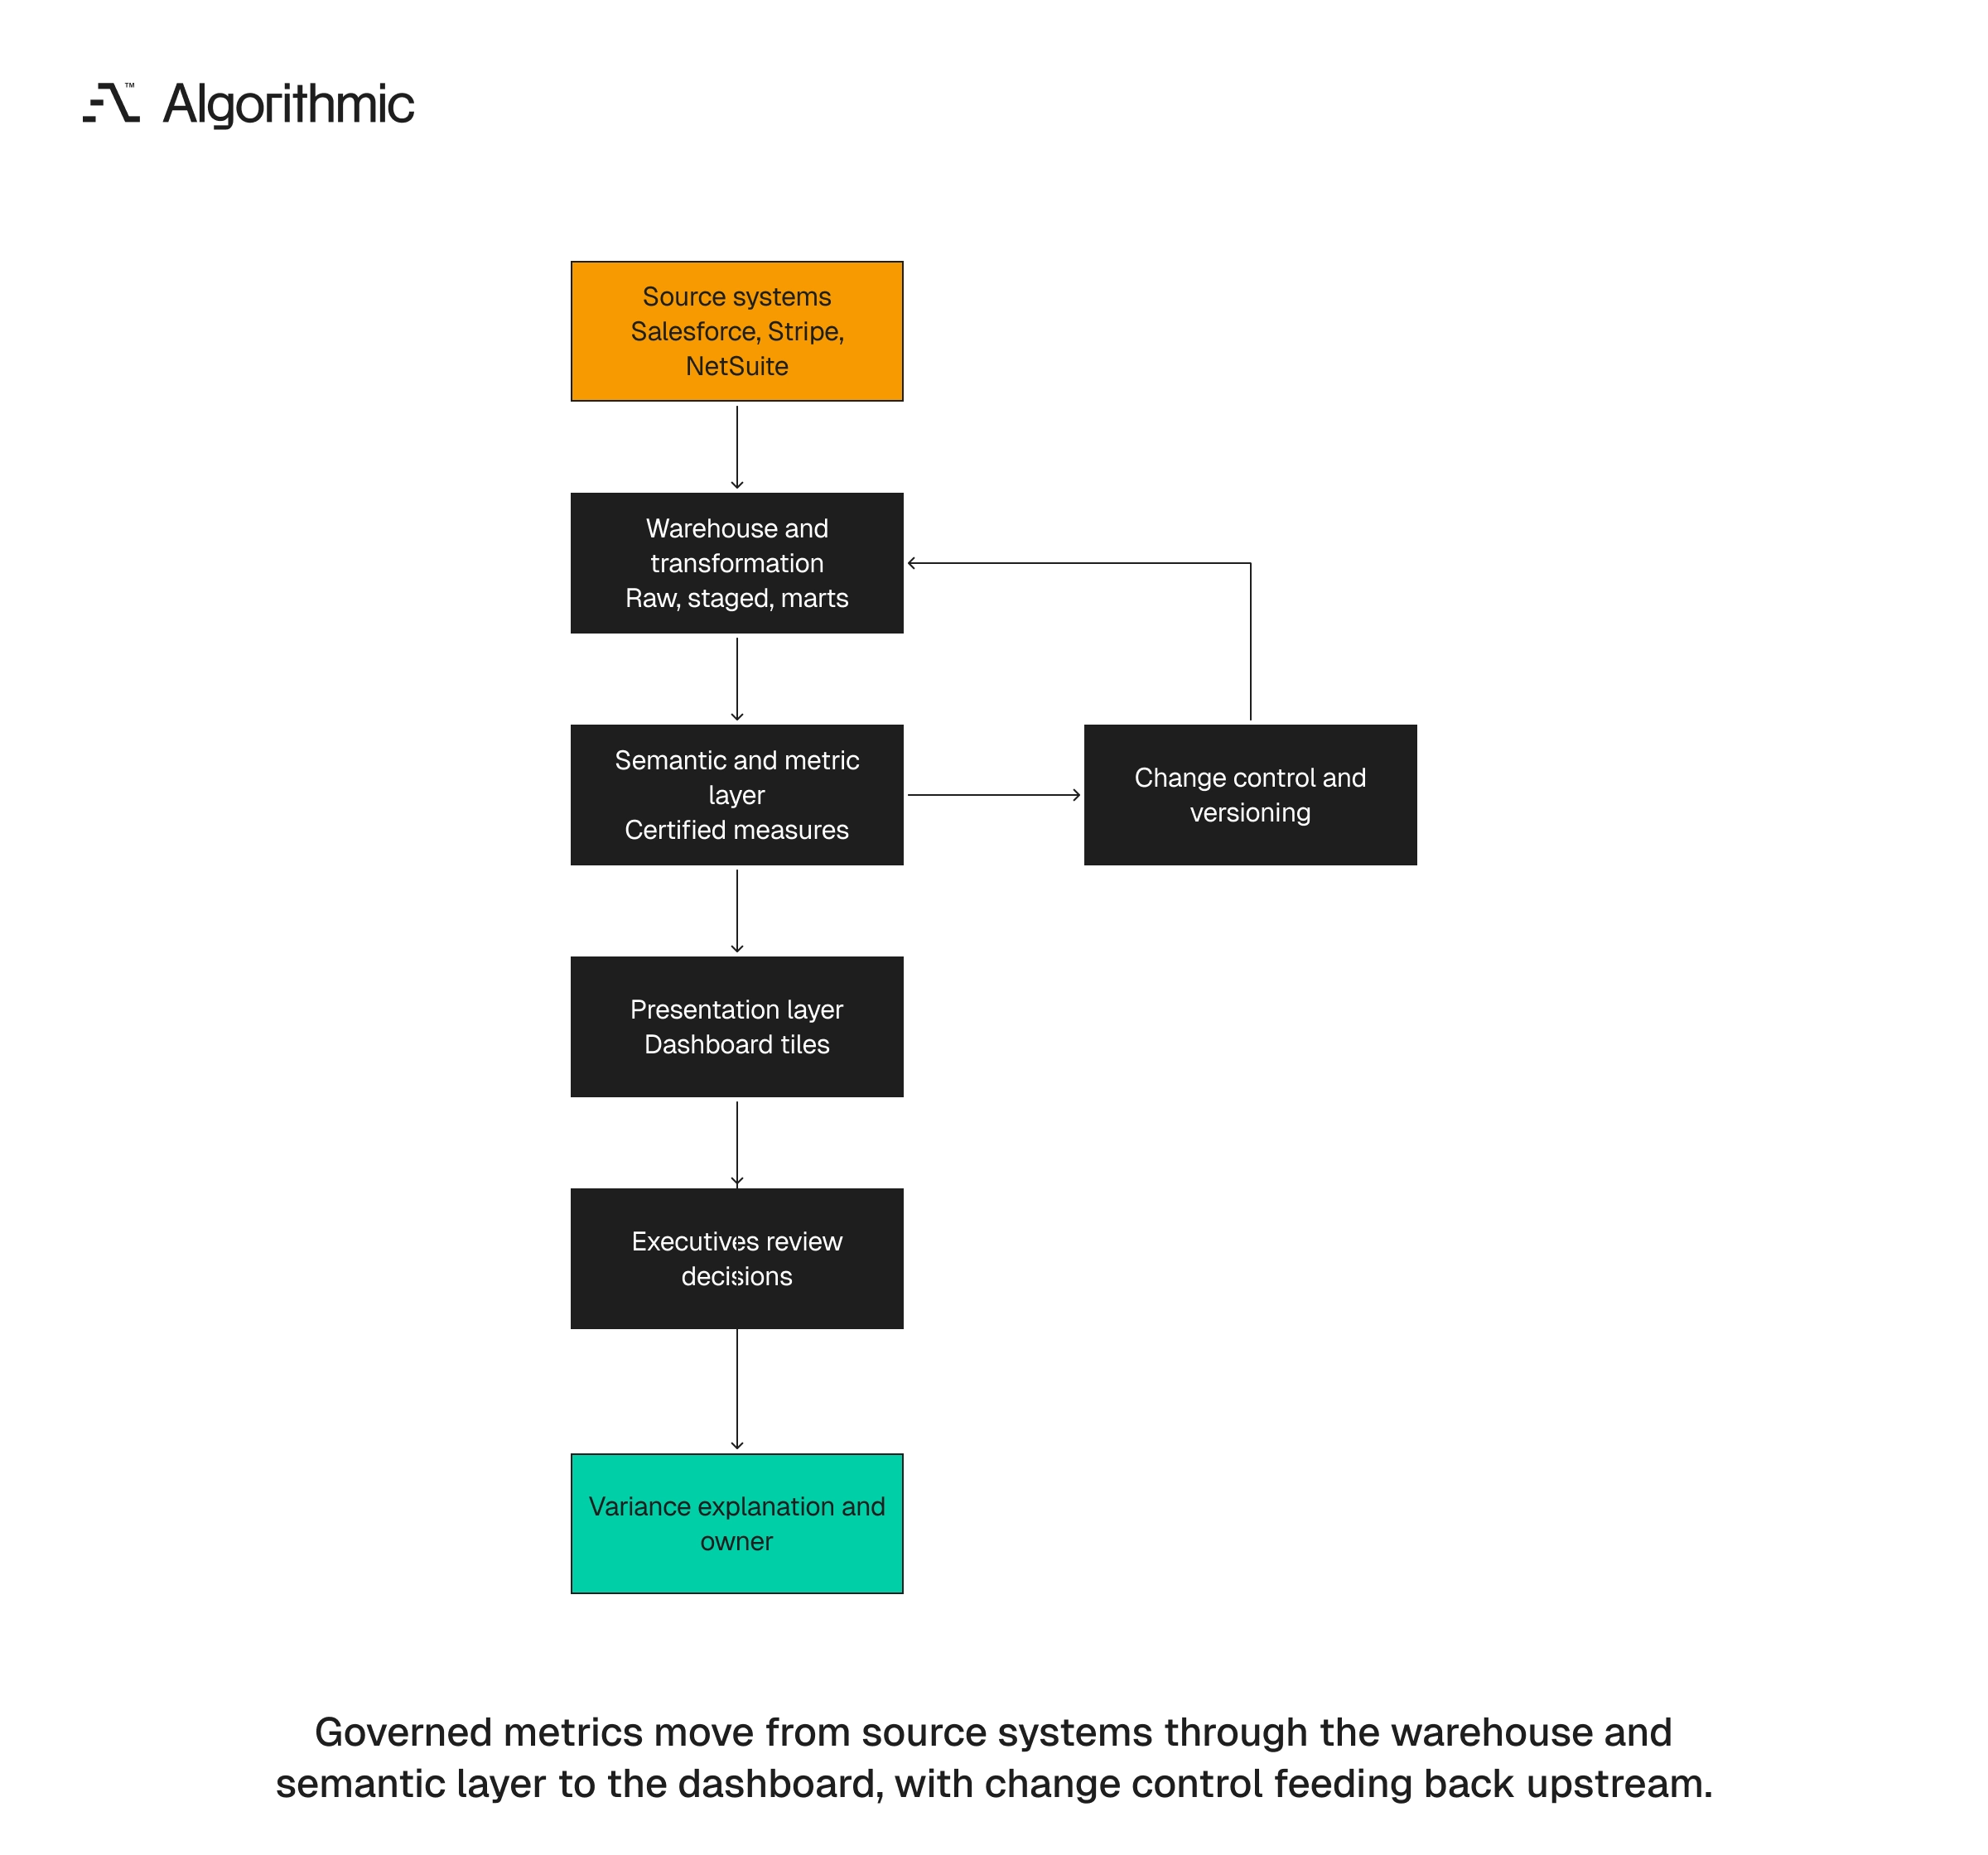
Metric drift occurs when definitions change in local dashboards, spreadsheets, or departmental marts. The architecture must make the approved path easier to use than the private path, because if the private path is faster, teams will use it under deadline pressure, and this is an operating reality rather than a tooling preference. A practical executive dashboard architecture has four layers, each with a distinct responsibility, and mixing responsibilities creates errors that are hard to find during an executive review, whether the error sits in a workbook calculation, a copied query, or a stale spreadsheet.
 Click to expand
 Source systems
Core systems include Salesforce, HubSpot, Stripe, NetSuite, Zendesk, product event pipelines, billing systems, and production application data, and each source system needs documented ownership and extraction rules. CRM fields, billing status values, and product events should have owners before they feed executive metrics, since a field without an owner becomes a reporting risk. Source data should not feed executive dashboards directly, because it changes shape, contains operating noise, and reflects application needs more than reporting needs. A Salesforce opportunity stage can change because of sales process design, not because pipeline health changed, so direct dashboard connections expose executives to source-system behavior.
Extraction rules must be explicit, since a Fivetran connector schedule, API rate limit, deleted-record policy, and backfill process affect dashboard trust. These technical details become executive issues when numbers fail to refresh before a board meeting, because the board sees the number, not the connector backlog. Source systems also need field-level definitions, so “customer status” in Salesforce, “subscription status” in Stripe, and “account state” in the application can mean different things, and the warehouse should reconcile those fields before they reach executive metrics through documented and tested logic.
Warehouse and transformation layer
The warehouse stores raw, staged, intermediate, and mart-level data, and dbt is commonly used to define transformations, tests, documentation, and lineage. This layer is where metric logic becomes reviewable code and where business rules become durable production assets. For executive reporting, teams should publish a small set of certified marts, such as mart_finance_arr, mart_customer_retention, mart_product_activation, and mart_executive_kpis, and each mart should have tests, owners, documentation, an approved refresh schedule, and a stated consumer group.
The transformation layer should also preserve auditability, since analysts need to trace an ARR number from dashboard tile to contract, invoice, subscription, and account hierarchy, and that trace is essential when an executive challenges a variance because without traceability the team can only explain the aggregate. A well-designed mart should expose the level of detail needed for dispute resolution, so for ARR that means account, contract, product, currency, start date, end date, and recognition rule, since aggregates alone are not enough for executive trust and the team needs detail when the CFO asks why one account moved.
The warehouse should also preserve historical definitions when needed. If the company changes churn rules in July, the data team should keep the prior rule for historical explanation, because versioned models prevent trend breaks from becoming unexplained anomalies and they let board materials show old and new definitions during transition.
Semantic and metric layer
The semantic layer maps governed business terms to calculation logic. It prevents each BI dashboard from redefining revenue, retention, activation, or LTV in its own model, and it reduces the number of places where formula changes must be made, since fewer copies mean fewer reconciliation paths. LookML, Cube, dbt Semantic Layer, MetricFlow, and Power BI semantic models all serve this function in different stacks, and the architecture decision that matters is centralization of metric logic and controlled reuse. The selected tool should match the team’s warehouse, BI, and engineering skills, so a small team should choose a pattern it can maintain.
A semantic layer requires governance discipline, because if every team can edit measures without review, the layer becomes another source of drift. Access control, code review, and release notes should apply to metric definitions, so the semantic layer should be treated like production code. The semantic layer should expose certified measures and hide unsafe calculations, so analysts see the approved NRR measure, approved ARR measure, and approved activation measure, while experimental measures remain in development namespaces and the namespace boundary protects executive reporting. This separation lets teams experiment without contaminating executive reporting, so product analytics can test a new activation definition in development while the board dashboard keeps using the approved definition until the change is reviewed and released with owner approval and version notes.
Presentation layer
The dashboard layer should be the final expression of governed metrics. It should handle layout, filtering, drill paths, and annotations, and it should not contain material business logic, so calculations inside the presentation layer should be limited to display behavior. This is where many executive dashboard projects lose discipline, because teams build calculations inside Tableau workbooks, Power BI reports, or spreadsheet exports when deadlines are near, and those shortcuts create future reconciliation work where a one-week shortcut often becomes a recurring monthly defect.
The presentation layer should make movement explainable, so variance markers, commentary fields, and drill paths should show the drivers behind a change, since a dashboard that displays a decline without driver context transfers analysis work to the meeting and slows the decision it was meant to support. Presentation also needs restraint, because executive dashboards should not contain every chart that a department finds useful, so a board dashboard should show the few measures tied to recurring decisions with drill paths for investigation while departmental detail belongs in operating dashboards. A strong dashboard tile has four elements, which are metric value, trend, threshold, and owner, and a stronger tile also has a variance explanation and a link to the metric contract, so that structure makes challenge handling part of the design and teaches executives where definitions live.
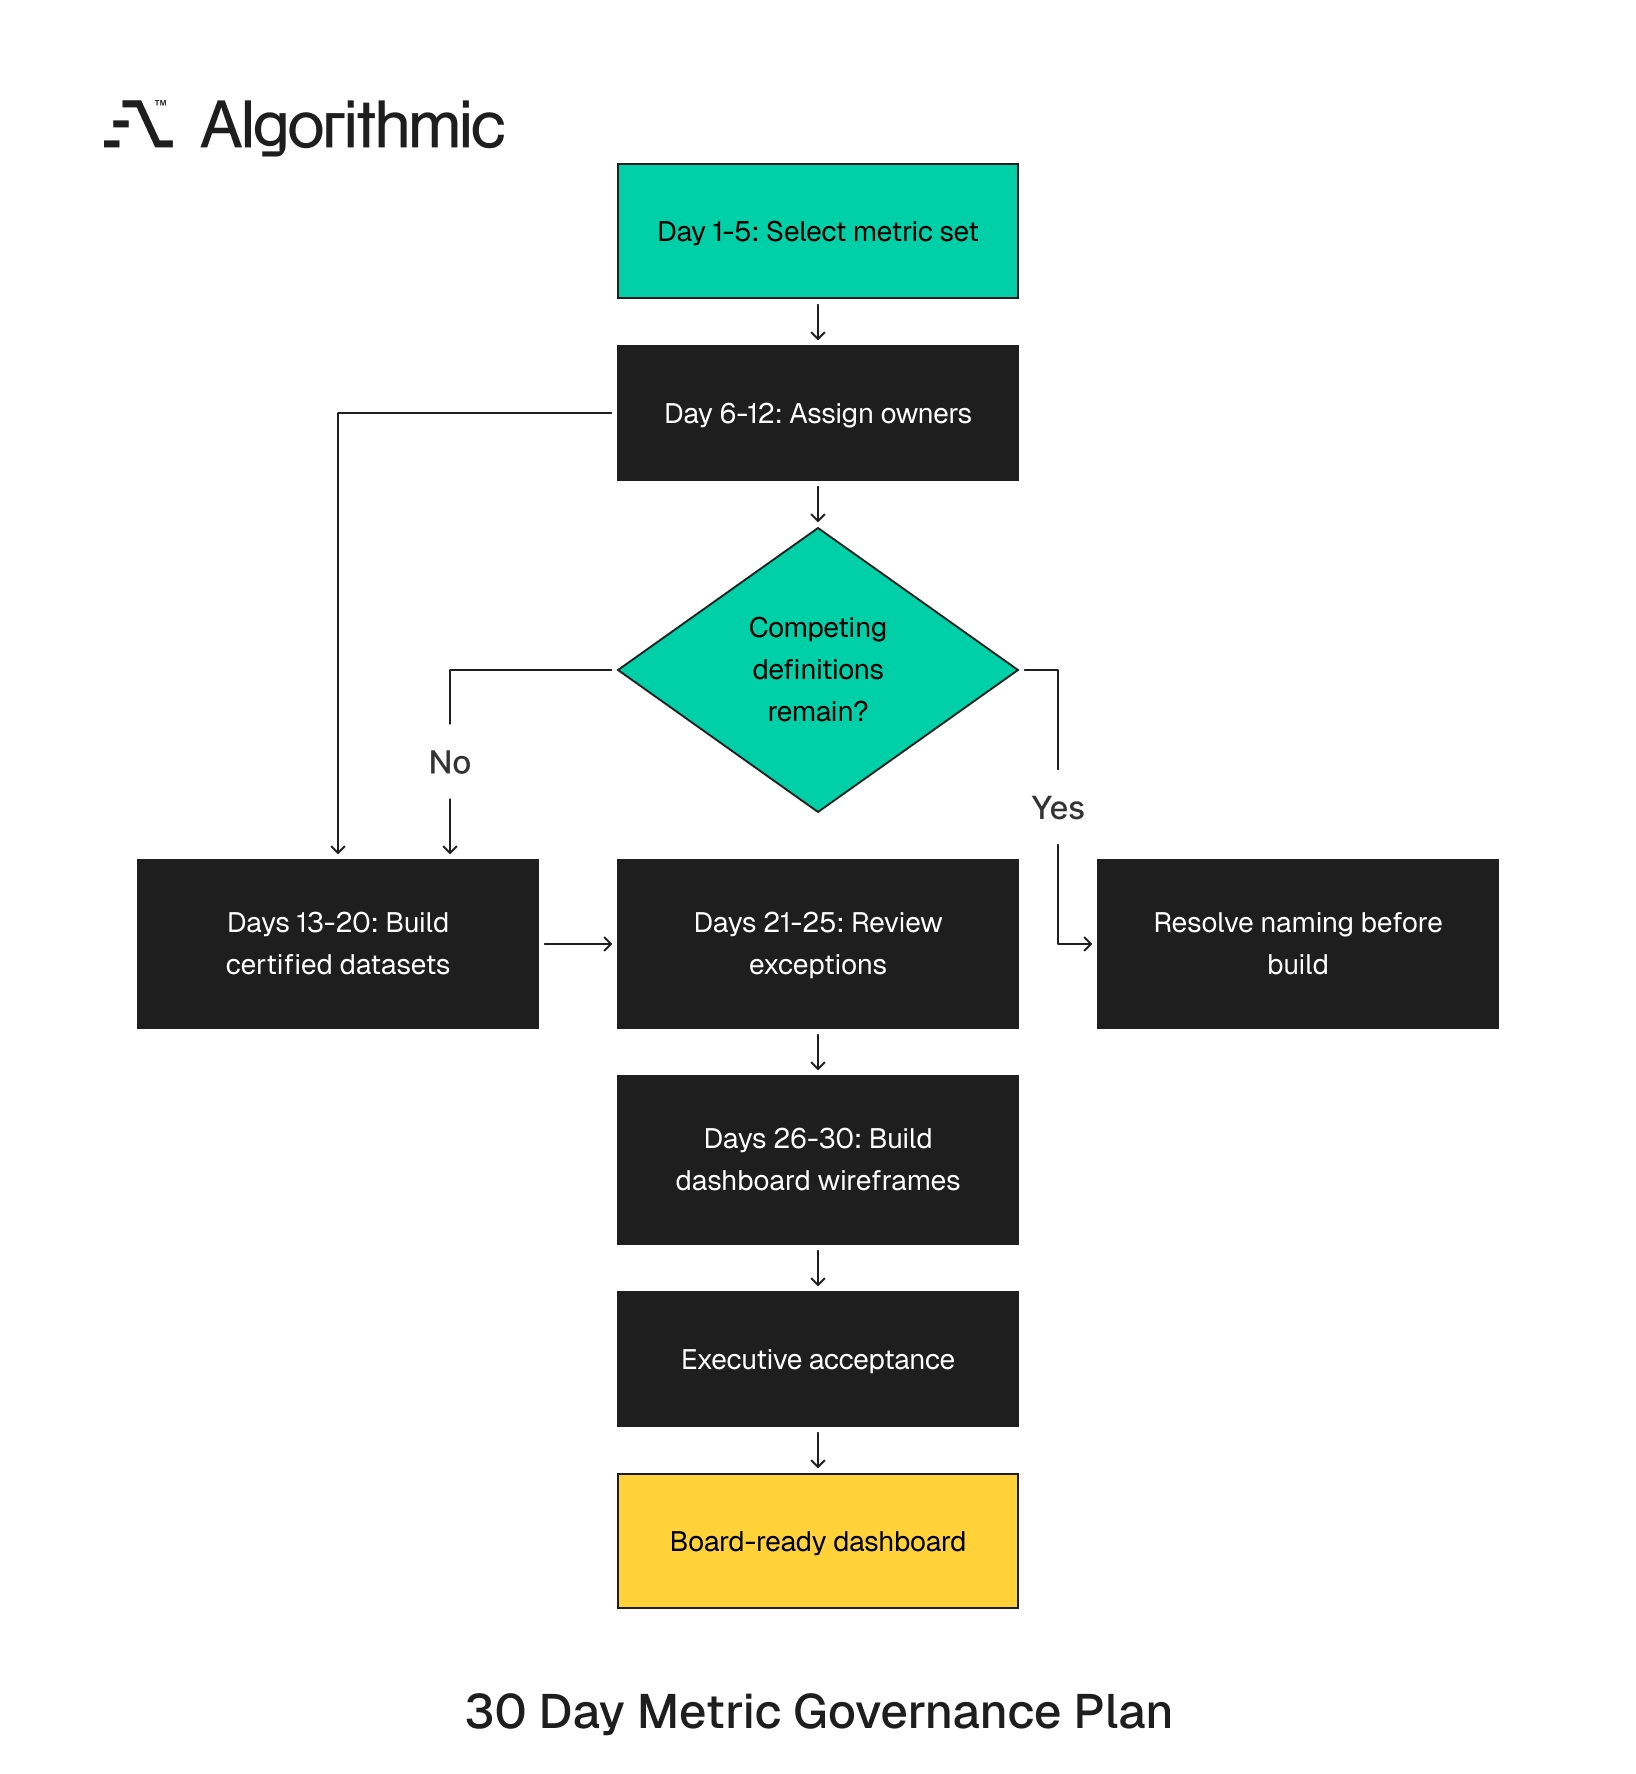
The 30-day metric governance sprint
A company does not need a six-month governance program before building an executive dashboard. It needs a focused metric governance sprint, and thirty days is enough to create the control layer for a focused first release when the scope stays narrow and decision-led. The sprint works when leadership limits scope and resolves disputes quickly, and it fails when every department preserves its preferred definition under the same metric name, so the sponsor must make naming and ownership decisions visible and unresolved disagreement should not hide inside BI design.
The sprint should produce production assets, not meeting notes. By day 30, the company should have approved metric contracts, certified datasets, owner records, and dashboard wireframes, and that output gives the dashboard team a controlled starting point while it gives executives evidence that the numbers are ready for board use.
 Click to expand
 Days 1 to 5, select the executive metric set
Limit the first pass to 10 to 15 metrics. Typical metrics include ARR, recognized revenue, gross margin, net revenue retention, gross revenue retention, and pipeline coverage, while other common metrics include CAC payback, activation rate, time-to-value, active accounts, support SLA attainment, and production incident severity, and the exact set should follow the decision inventory. Each metric must map to a decision, so remove metrics that inform no decision, because a metric included for curiosity will consume review time and create maintenance cost while curiosity belongs in exploratory analysis, not board reporting.
This phase should produce a one-page metric inventory that lists the decision, owner, cadence, current source, and current dispute status. Disputed metrics should remain visible until resolved, since hidden disagreement returns during acceptance or board review. The inventory should also rank metrics by board relevance, so ARR, retention, margin, and pipeline coverage usually belong in the first release while departmental diagnostics should remain in operating dashboards until they support a board-level decision, which keeps the executive view focused. A CTO dashboard may include latency and incident severity if those measures connect to renewal risk or contractual commitments, and if the measures lack a decision owner they should stay out of the executive release, since this discipline keeps the first version narrow enough to ship and prevents infrastructure metrics from becoming decorative charts.
Days 6 to 12, assign owners and write metric contracts
Assign one executive owner and one analytics owner for each metric, then write the metric contract in a standard template. The template should include formula, grain, source systems, exclusions, refresh cadence, and acceptance criteria, and it should also include sample rows and failure conditions. Do not allow competing definitions to remain open, so if Sales and Finance need different revenue measures, name them differently and show them in different contexts, since a signed-contract metric and a recognized-revenue metric can coexist when their names and uses are clear, where ambiguous labels create conflict while precise labels create choice.
The most difficult discussions usually involve exclusions, since internal accounts, trials, paused customers, refunds, reseller contracts, and migrated customers require explicit rules. These rules should be documented before analytics engineering writes production models, otherwise SQL becomes the place where policy gets decided. During this phase, the sponsor must decide unresolved naming conflicts, because “customer” may mean billing entity, workspace, legal entity, or active account, and the dashboard cannot carry that ambiguity into development, so a single term must map to a defined entity. A useful contract review meeting includes the executive owner, analytics owner, and one downstream consumer, and it should approve examples, edge cases, and failure conditions, which prevents late objections during acceptance and makes the contract defensible when another team asks for a local variant.
Days 13 to 20, build certified datasets
Analytics engineering should build the approved metrics in governed tables or semantic models. This work includes tests, lineage, documentation, and reconciliation checks against existing reference reports, and the output should be production-ready data assets, not temporary dashboard extracts, because temporary extracts create hidden logic and weak audit paths. For financial metrics, reconcile against the system of record, for product metrics reconcile against event counts and known customer samples, and for customer metrics validate account mappings and hierarchy logic, since these checks catch the defects that usually surface during executive review.
The team should record reconciliation differences, so a $12,000 ARR variance may be acceptable if the cause is known and documented, while an unexplained variance should block certification, because certification means the team can explain the number at account or transaction level. This phase also exposes source-system debt, with common examples including duplicate Salesforce accounts, missing Stripe subscription IDs, inconsistent NetSuite customer mappings, and product events without tenant IDs, so the sprint should fix blockers and log lower-priority defects, since a defect that changes a board metric is a blocker. Analytics engineering should resist one-off dashboard patches, because if a rule belongs in ARR it belongs in the certified model, and if a filter belongs in retention it belongs in the metric contract and implementation, so presentation-layer patches should be treated as defects, not delivery tactics.
Days 21 to 25, review exceptions and approve changes
Most organizations find contested rules during this phase, with examples including treatment of migrated customers, paused subscriptions, partial refunds, reseller contracts, and multi-product accounts. These exceptions are where metric governance becomes concrete, since a rule becomes real when applied to actual accounts. Document decisions in a metric change log and assign effective dates, then keep historical versions when the change affects trend interpretation, and the change log should state what changed, who approved it, and which periods are affected. The change log should also state the business reason for each rule, so “excluded from NRR because the customer had no active contract at period start” is useful while “excluded by Finance” is not enough for later review, because future teams need the reason, not only the approver.
Exception review should include actual accounts or transactions, since abstract debate over churn rules can run for weeks while a list of 20 disputed accounts forces a decision. The owner must decide how the rule applies, then approve the rule rather than every future case, so once the rule is approved analytics engineering can apply it consistently and edge cases that break the rule enter the next change-control review, which keeps production metrics stable between release cycles.
Days 26 to 30, build dashboard wireframes from approved metrics
Only after metric approval should teams design the executive dashboard. Wireframes should show decision groupings, thresholds, variance indicators, drill paths, and commentary areas, and the wireframe should reflect how executives make decisions rather than how source systems store data. A useful dashboard explains movement, so a chart that shows ARR declined by 3.8% is incomplete without drivers such as churn, contraction, delayed go-lives, or foreign exchange effects, since executives need driver context before they can act and the dashboard should shorten the path from variance to decision.
Wireframes should include annotations for known data limits, so product activation may be reliable from January onward because event tracking changed in December, and that annotation protects trust when trend history is incomplete while it prevents readers from overinterpreting older data. The wireframe should also specify refresh timing, because a dashboard used Monday morning should not depend on a source refresh that completes at noon, so timing is a product requirement for executive reporting and refresh timing should be visible in the dashboard metadata. By day 30, leadership should review the wireframe against the decision inventory, so every chart maps to a recurring decision, every metric links to its contract and certified asset, and anything else leaves the first release.
What leadership should fund
Executive dashboard development is business intelligence engineering with governance, data modeling, and executive decision design. Funding only visualization creates a visible artifact without a reliable operating foundation, and the artifact then becomes a source of dispute, so the organization pays for visual polish and receives faster access to unresolved definitions. This is the same failure mode that shows up in data platform ownership when revenue has three names, where the data platform inherits disagreements the business never settled.
A realistic budget for a mid-market executive dashboard ranges from $75,000 to $250,000, and the range depends on source-system complexity, data quality, metric disputes, and BI stack maturity. The work usually requires 6 to 10 weeks for a focused first release when decision scope is controlled, and that timeline assumes owners can resolve definitions within days, not weeks. A fragmented data environment with unresolved Finance and Sales definitions can push the timeline beyond 16 weeks, and the extra time rarely comes from chart design, since it comes from account hierarchy cleanup, contract logic, billing reconciliation, and agreement on metric ownership, which are data operating costs that visual design cannot remove.
The team should include an executive sponsor, a Finance owner, a Product or Customer Success owner, an analytics engineer, a data engineer, and a BI developer. For complex environments, add a solution architect who can make data warehouse architecture and semantic layer decisions, and the sponsor should have authority to resolve cross-functional definition disputes. Tool selection should come after metric governance, because Tableau, Power BI, Looker, Sigma, and Mode can all produce effective executive dashboards, and none of them resolves contested definitions without disciplined metric ownership, so the tool will display the logic the organization gives it.
The funding plan should separate governance, data engineering, semantic modeling, and dashboard design, since a single line item called “dashboard build” hides the work that determines success. Executives should know which dollars fund definition control and which dollars fund presentation, and this distinction improves scope control and vendor accountability. A strong funding model also includes post-launch ownership, because executive dashboards need release management, incident response, and quarterly metric review, so the first release is a controlled operating asset with an owner, service expectations, and a release process, not a one-time presentation project.
Maintenance is modest when the architecture is clean, since a named analytics owner can review tests, publish release notes, and handle source-system changes, and it becomes expensive when business logic lives inside workbooks and spreadsheet exports because every workbook then becomes a hidden application. Leadership should also fund repair work when source systems block trust, so duplicate account cleanup, contract normalization, event schema repair, and billing reconciliation are dashboard work when they feed executive metrics. Excluding that work from scope guarantees a polished dashboard over unreliable inputs, and the dashboard team will inherit the defect during acceptance or board review.
The Algorithmic point of view
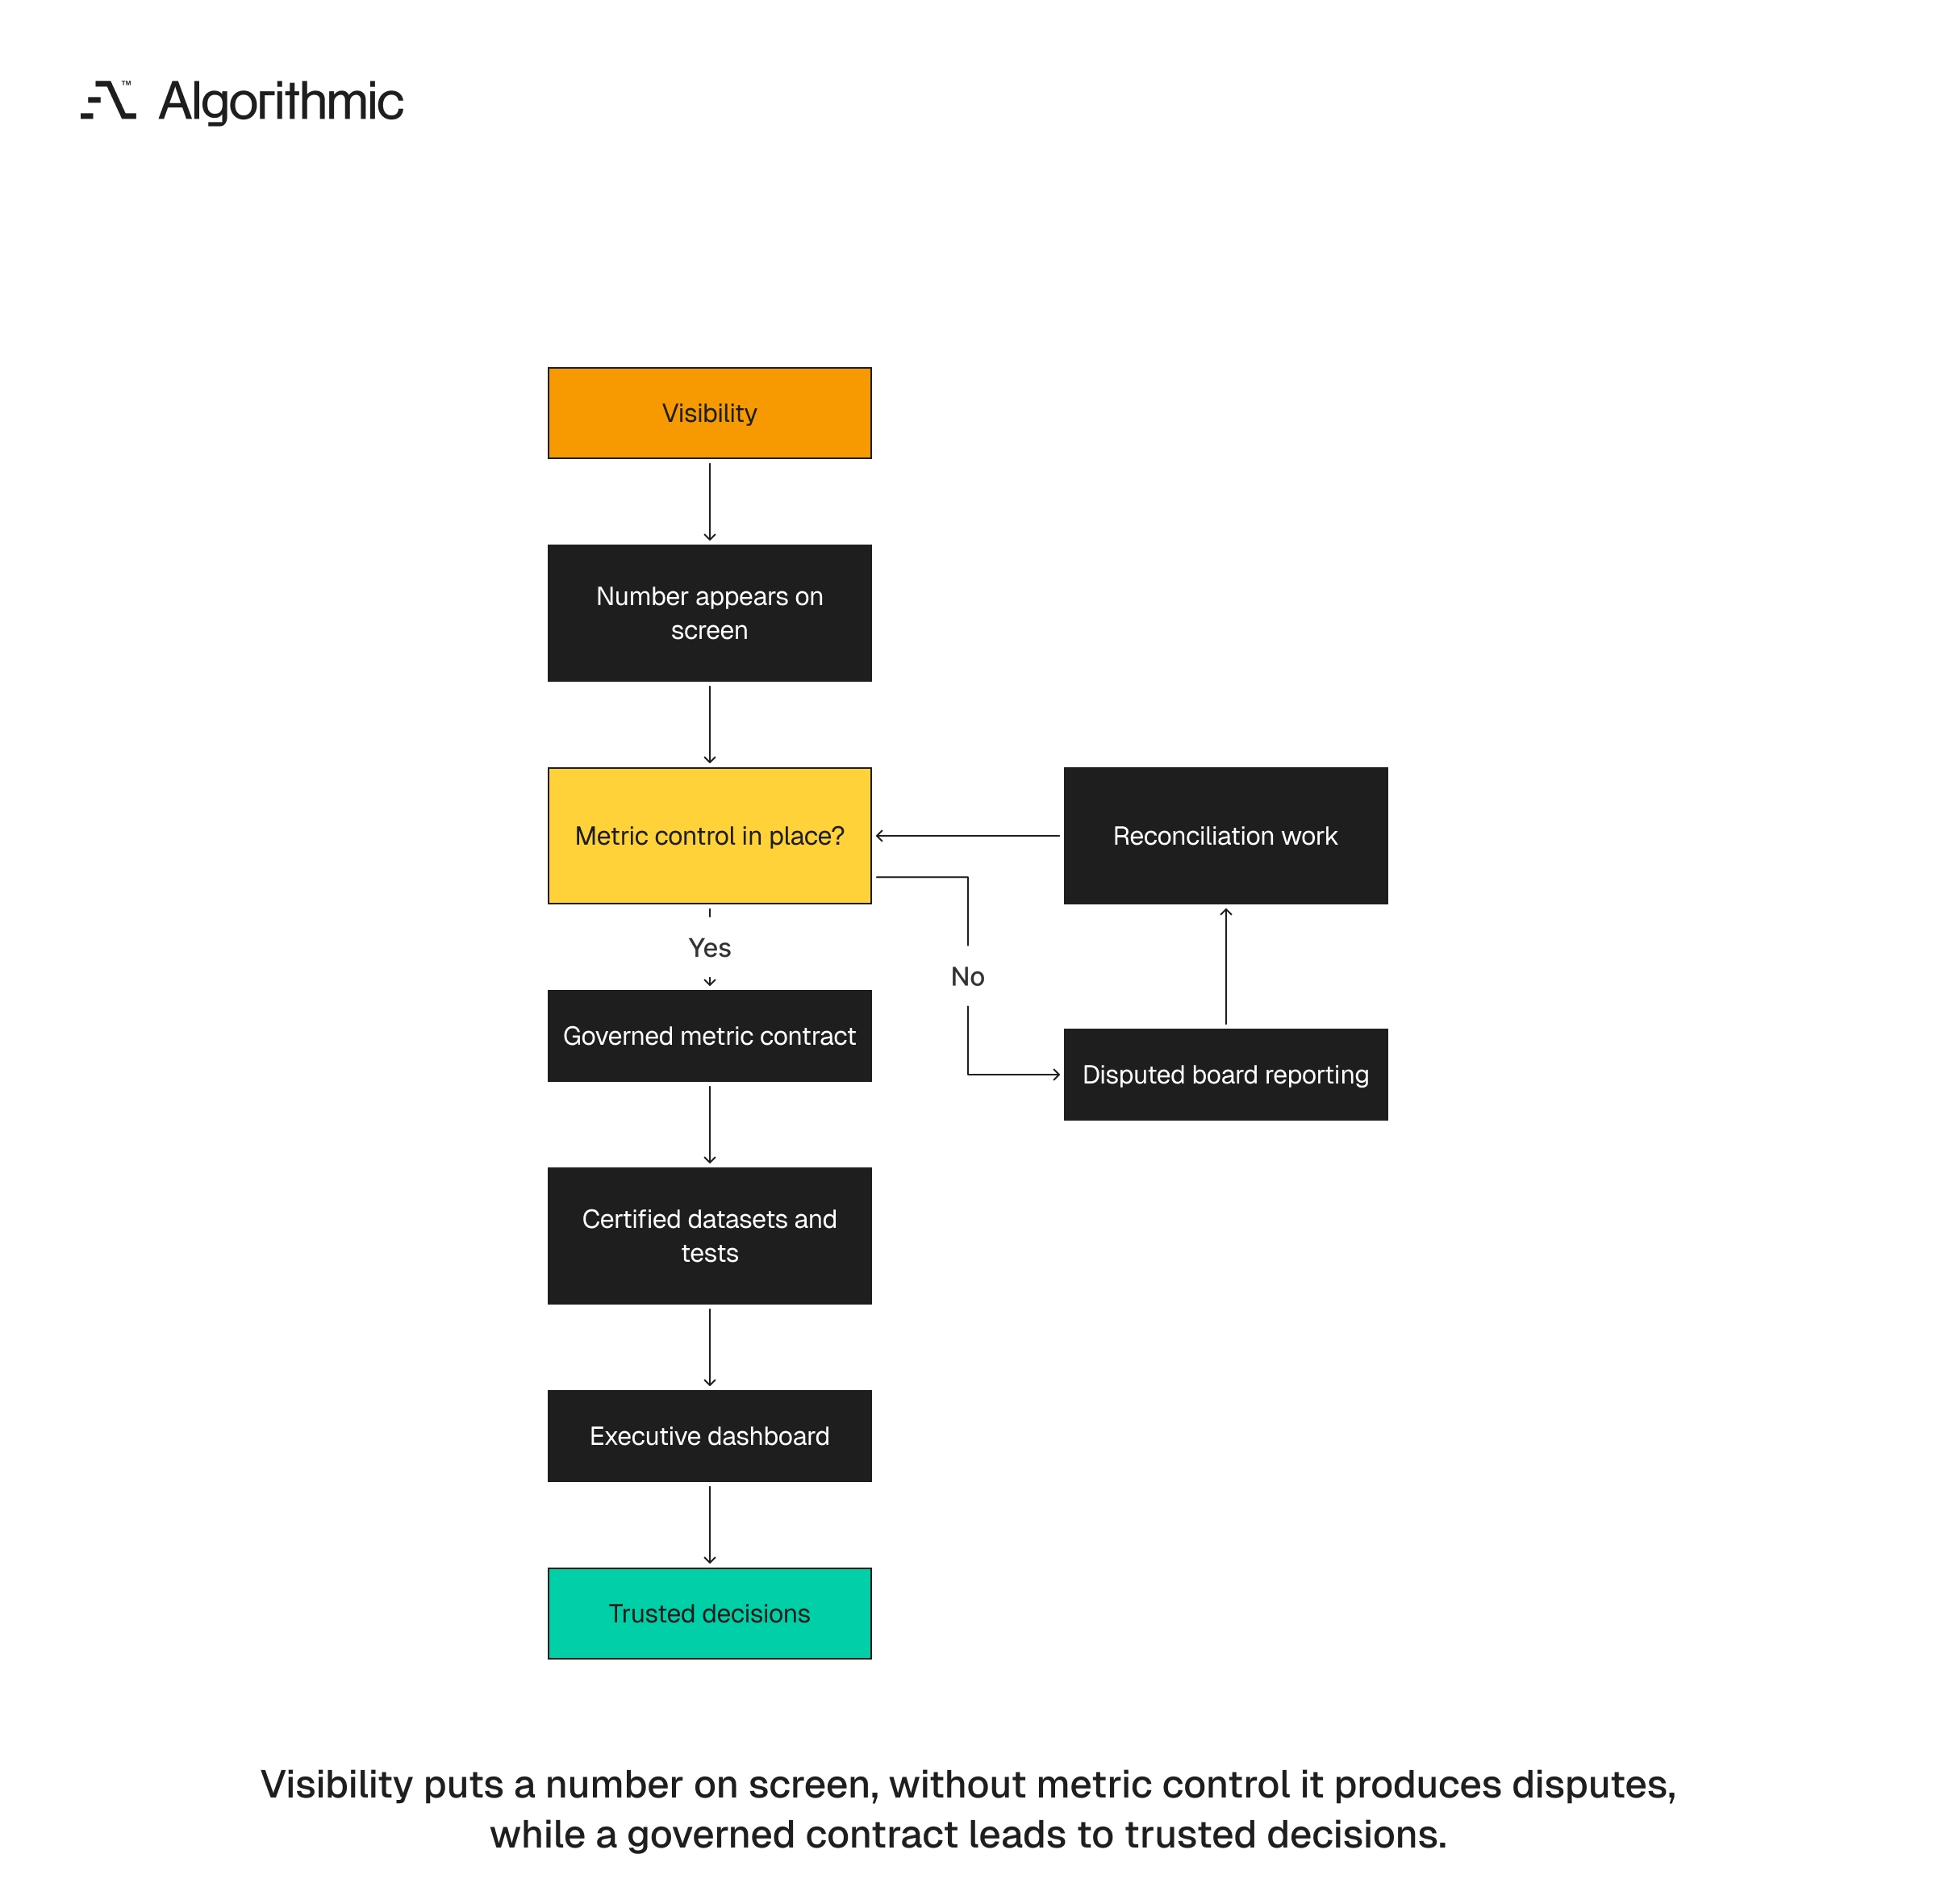
Executive dashboards fail for a simple reason, since companies confuse visibility with control. Visibility shows a number, while control defines the number, owns it, tests it, versions it, and makes it safe for decisions, so executive reporting requires control before design.
 Click to expand
 The executive dashboard is the last mile of the metric system. It should receive certified metrics from governed data assets, and it should not become the place where business rules are invented under deadline pressure, since business rules belong in metric contracts and certified models. The practical architecture is clear, where source systems feed the warehouse, the warehouse produces certified marts, the semantic layer exposes approved measures, and the presentation layer shows movement, thresholds, owners, and annotations. This architecture gives executives a stable interface to the business and gives analysts a controlled path for change, so a metric dispute becomes a governed decision, not a recurring meeting failure, and the organization learns once, encodes the rule, and applies it consistently.
Founders and CTOs should be direct with their teams on this point. A beautiful dashboard with disputed metrics is unfinished work, while a plain dashboard with canonical metrics is a management system that will outlast the first set of charts. That tradeoff matters during fundraising, board reporting, and annual planning, because investors and directors do not need more charts, they need numbers that survive challenge and drive decisions, and the dashboard earns trust when the metric system behind it holds.
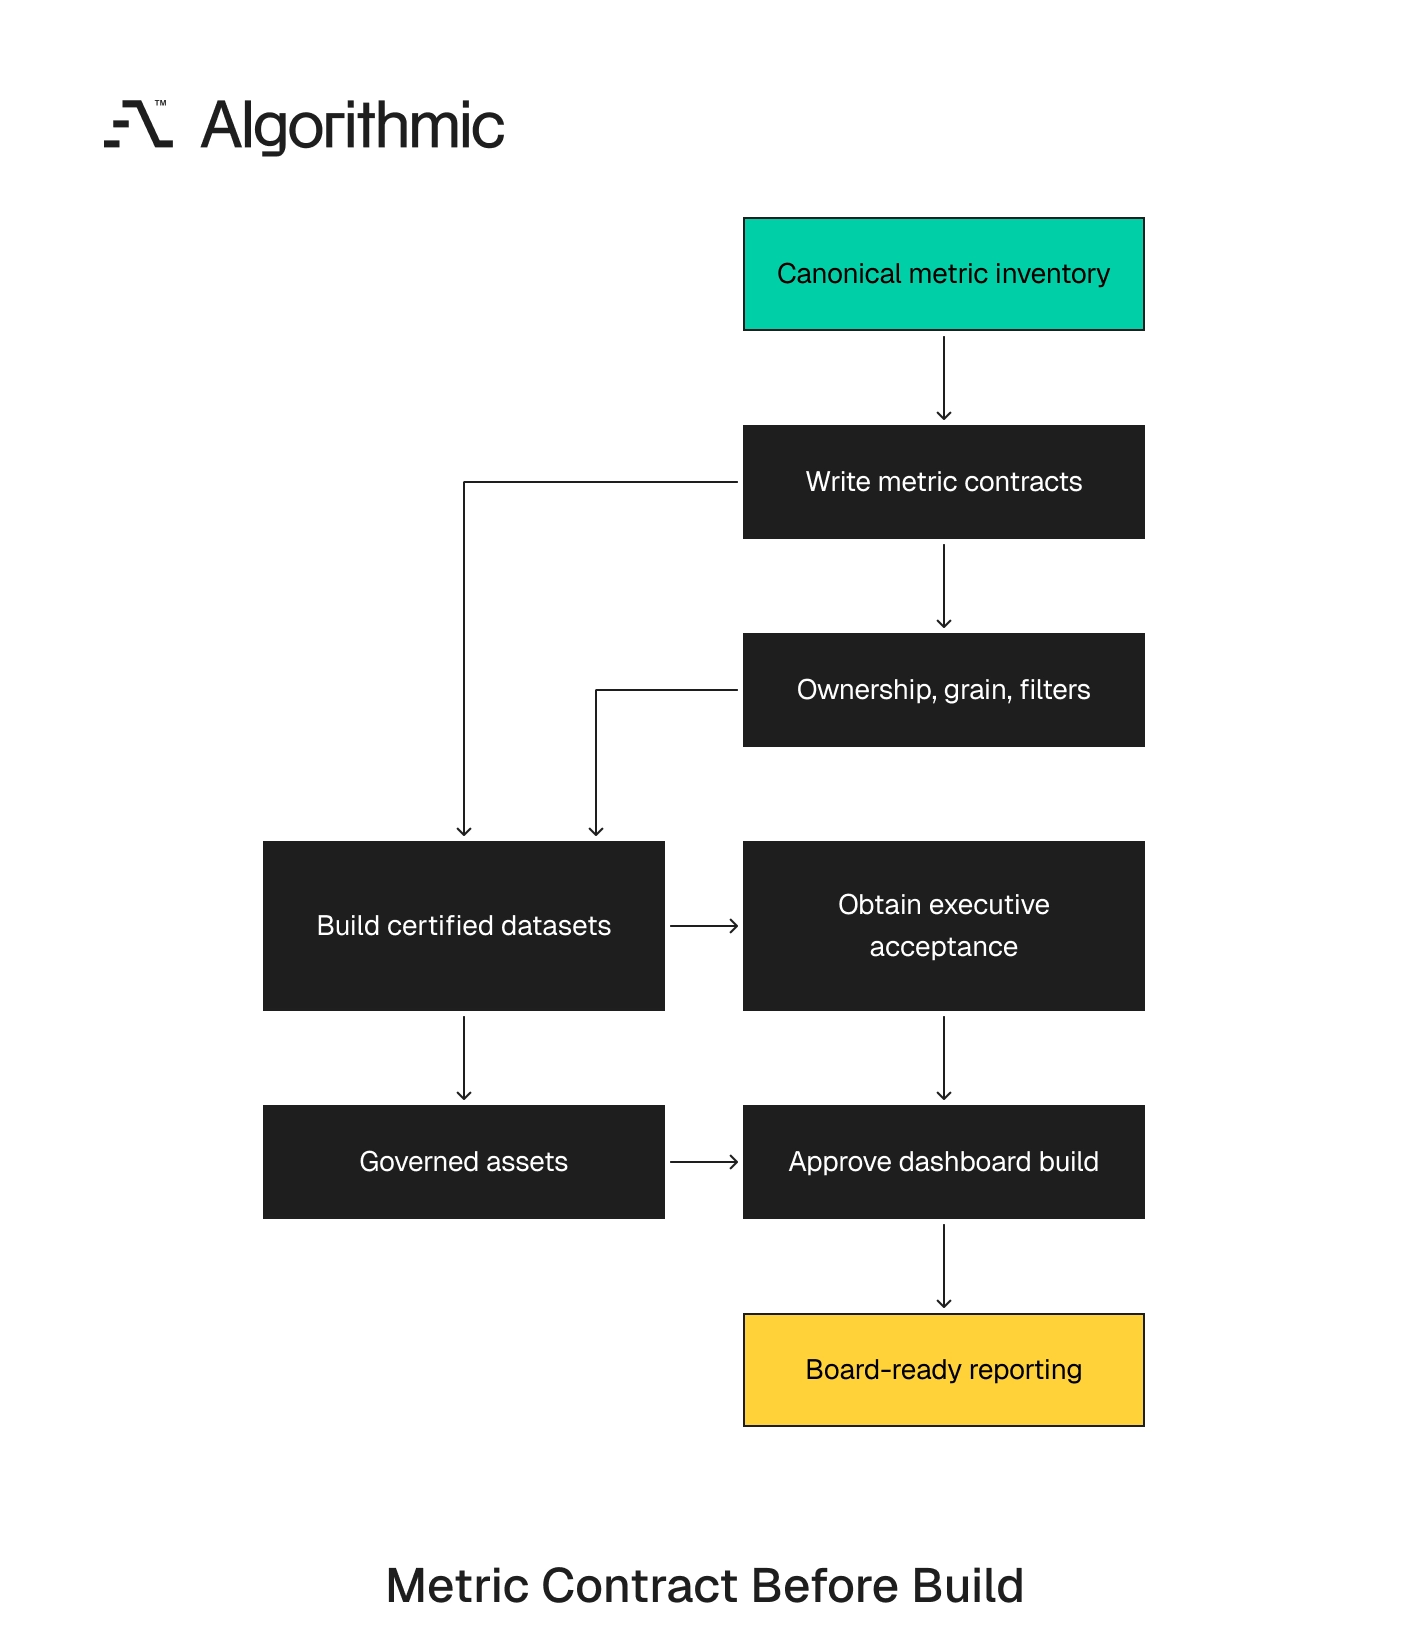
Start with the metric contract then build the dashboard
Before approving an executive dashboard budget, require a canonical metric inventory for revenue, retention, activation, LTV, margin, pipeline, and customer health. Assign one owner to each metric, then write the formula, grain, filters, exclusions, time rules, and source lineage.
 Click to expand
 Then fund the dashboard build, since the dashboard will move faster because the most expensive arguments will already be resolved. Analysts will build from governed assets instead of reconstructing definitions during every review, and executives will spend review time on decisions, not reconciliation. The direct next step is a 30-day metric governance sprint, where you select the executive metric set, write metric contracts, build certified datasets, and obtain executive acceptance before visualization work begins. That sequence gives the board a dashboard it can use for decisions instead of reconciliation, and it gives the data team a durable operating model for every dashboard that follows.
Algorithmic runs analytics and business intelligence engineering that starts with canonical metrics, named owners, and certified datasets before any chart is built. Start a conversation if your board keeps reconciling numbers instead of making decisions.