

A SaaS company can process millions of product events every month and still miss the board-level question that matters, which is which customers received value this week. Most customer analytics platforms count activity with precision. They report sessions, clicks, page views, logins, exports, searches, and API calls, yet they miss the event that proves a customer received the product outcome they paid for.
That gap damages operating discipline. Activation scoring, retention forecasting, support triage, customer success planning, and expansion targeting all weaken when teams work from separate definitions of customer health. The market is spending heavily on this problem. Mordor Intelligence estimates the customer analytics market at USD 17.58 billion in 2026 and USD 41.28 billion by 2031, an 18.62% CAGR, and projects the customer data platform market to reach USD 13.14 billion by 2031.
That spending earns its return when the platform connects product behavior to revenue and retention, and that connection starts with value moment instrumentation. Algorithmic builds this measurement layer as part of our data analytics and business intelligence work, where the event that proves value becomes the anchor of the whole model.
Activity volume is an incomplete measure of customer progress
Standard analytics tools make event volume easy to collect. Google Analytics 4 provides an events report that shows event counts and users per event, and Amplitude documents how to choose the right measurement across uniques, totals, frequency, averages, and formulas. These measurements help teams understand attention and usage patterns, but they do not prove that a customer received the promised outcome. A product-led business needs activity measures and outcome measures in the same operating model.
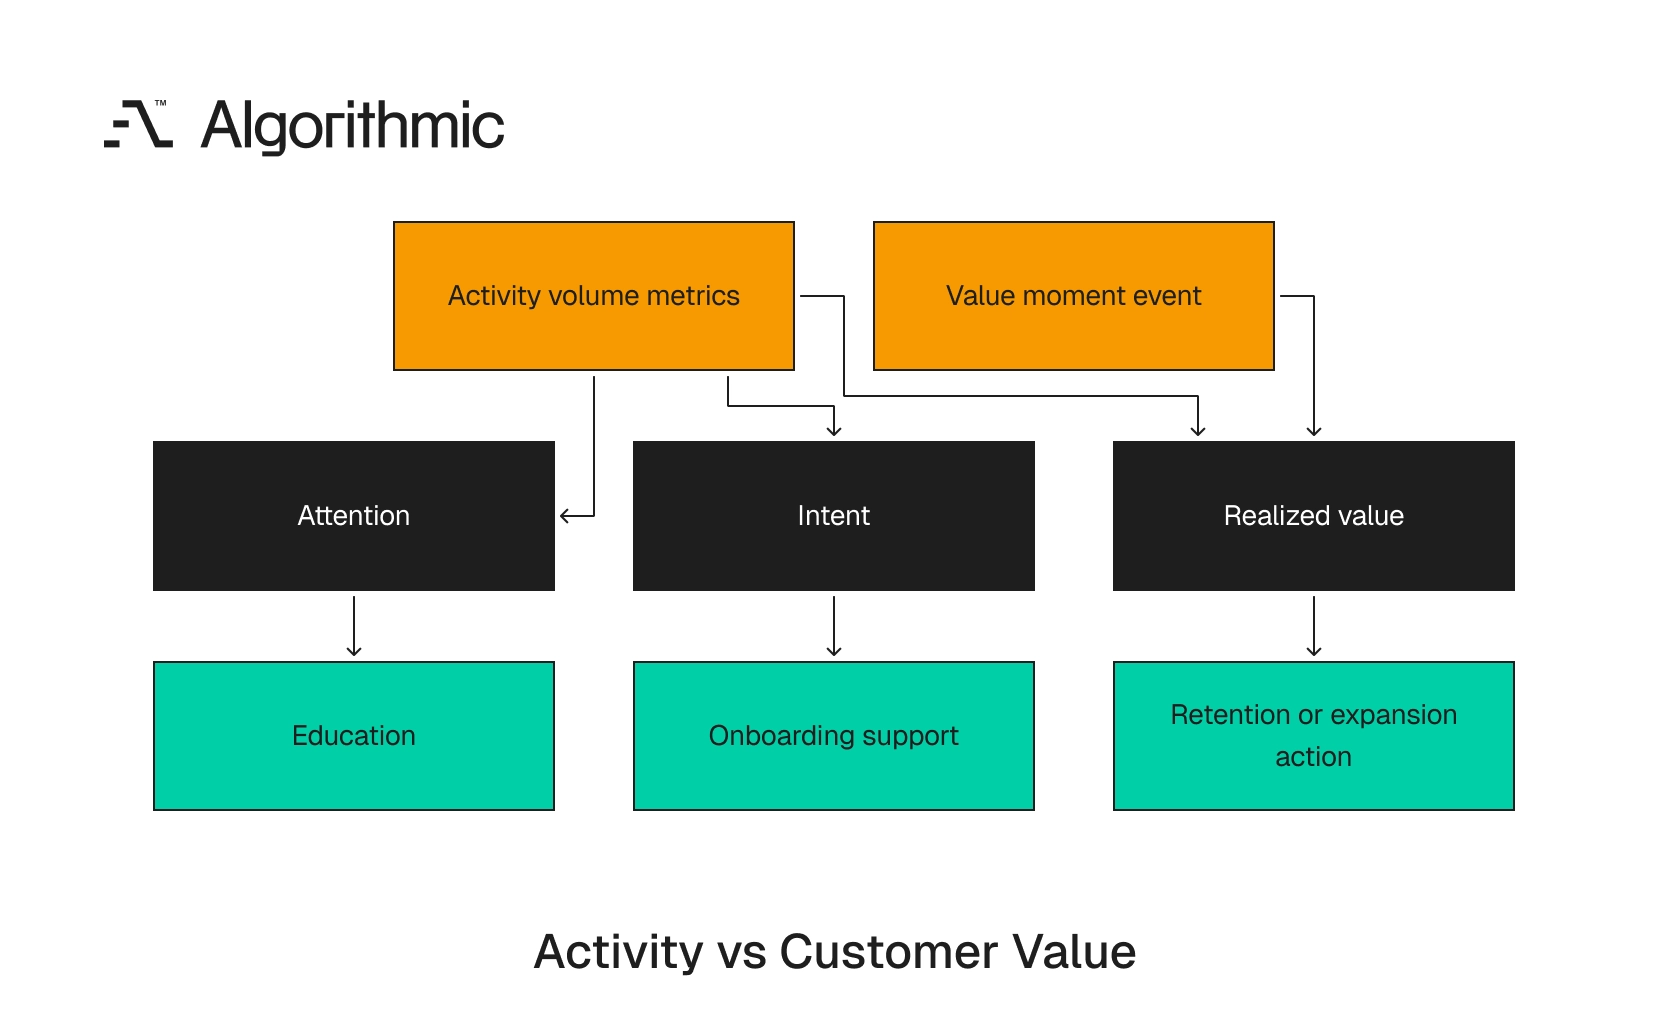
A user who logs in twelve times has shown attention, a user who invites three teammates has shown intent, and a user who completes the value moment has shown realized value. Those three states require different responses. Attention needs education, intent needs onboarding support, and realized value needs expansion, retention, or deeper adoption planning.
 Click to expand
 For a design collaboration product the value moment can be a first shared prototype receiving a comment from a collaborator. For a data platform it can be a first scheduled pipeline completing and being queried by a downstream dashboard. For an AI writing tool it can be a first generated document being exported or published. The value moment must be specific enough to instrument, demanding enough to matter, and close enough to the first journey that activation can be measured within days.
Consider a B2B workflow platform where weekly active accounts rose 31% over two quarters while net revenue retention fell. The platform counted logins, workflow edits, and notification opens, but it did not track whether a workflow reached final approval from an external party. That external approval was the economic reason customers bought the product. The activation dashboard showed progress while renewal risk kept rising. The leadership team had accurate activity counts and incomplete operating truth, product managers celebrated higher engagement, and customer success managers saw more accounts reach renewal without the outcome the customer expected.
This pattern appears in SaaS companies at every stage. Early teams instrument events to support product iteration, and later the same event model feeds board reporting, customer health, sales prioritization, and renewal forecasting. The original event taxonomy rarely survives that transition, since it records what users touched and lacks the proof needed to distinguish use from value.
The operational damage grows as teams add more dashboards. A product team can report a 19% lift in weekly active users while customer success reports a rising count of stalled accounts, and revenue leaders then spend the operating review reconciling definitions instead of assigning owners. A board packet can show higher usage and weaker retention in the same quarter, and that contradiction usually means the company measured movement instead of outcome. A value moment creates a shared point of reference. It gives product, support, success, sales, finance, and engineering one event that represents a fulfilled product promise, and that shared event reduces debate in the moments when speed matters.
A value moment requires a production data contract
A value moment is the event that shows the user received the product’s promised value, and it must be defined as a production data contract with schema, ownership, tests, and service-level targets. A dashboard metric can tolerate interpretation, but a data contract requires explicit meaning. The event must mean the same thing in product analytics, revenue operations, support tooling, and board reporting.
The event name, trigger condition, actor, account scope, timestamp, source system, and revenue linkage must all be explicit. A value event fired from the frontend after a button click rarely carries enough proof, so the system must confirm that the promised outcome occurred. For an analytics platform, report_export_clicked is weak instrumentation while report_export_completed_with_recipient_opened is stronger, because the first event records intent and the second records delivery and consumption.
That distinction changes cohort analysis. A product team can test onboarding variants against value completion rate, and revenue operations can compare value completion by segment, channel, plan, and sales motion. Customer success can identify accounts that paid for seats and never crossed the activation threshold, support can see whether an urgent case comes from an account still waiting for first value, and finance can compare retention by time to value and contract size.
The contract also prevents retrospective metric editing. Without a contract, teams redefine activation after a difficult quarterly review, whereas with a contract the discussion moves to product experience, onboarding quality, and customer fit. A production contract protects engineering time too, since engineers should not reverse-engineer the meaning of completed, published, or activated six months after launch. The definition should live beside the code path that emits the event, and it should state the failure condition as clearly as the success condition. A workflow approval that returns an error should emit a failure event with a reason code, and a generated report that never reaches the recipient should remain outside activation.
Minimum fields for a value moment event
A production-grade value event should include these fields:
| Field | Purpose | Example |
|---|---|---|
event_name | Stable event identifier | first_pipeline_successfully_queried |
user_id | Actor-level analysis | usr_87291 |
account_id | B2B lifecycle analysis | acct_44102 |
occurred_at | Time-based cohorting | 2026-03-14T10:42:21Z |
value_object_id | Entity that carried value | pipeline_9931 |
source_system | Lineage and audit | backend_orchestrator |
plan_tier | Revenue segmentation | pro |
account_arr | Commercial weighting | 48000 |
journey_stage | Activation state | first_7_days |
validation_state | Data quality control | confirmed |
This schema lets data engineers build activation, retention, and revenue models from the same event base, and it prevents product teams from redefining activation after each quarterly review. The schema should live in version control with the same discipline used for APIs. A pull request that changes validation_state or event trigger logic should identify downstream models and dashboards, and data owners should review the change before it reaches production.
The field list is a starting point. Regulated products also need tenant region, consent state, data residency marker, and audit identifier, and usage-based pricing products need consumed units, metered quantity, and billing object identifier. A strong contract also defines exclusion rules, so internal test accounts, QA workspaces, suspended customers, expired trials, and migration sandboxes are removed from business-facing metrics. Those exclusions need names, owners, and automated tests.
The contract should define idempotency. If a job retries four times and succeeds once the platform should emit one confirmed value event, and if a customer repeats the same value action every week the platform should record first value and continuing value separately. This distinction prevents polluted activation metrics, since first value proves onboarding success and continuing value measures operating adoption. The contract should also define late-arriving data behavior, because a payment processor, job queue, or external integration can confirm the outcome hours after the user action. The model should update the original account state without double-counting the event.
Event contracts need change control. If a product team adds a new workflow path, the value moment contract should be reviewed before release, which prevents silent gaps where customers receive value through a path the analytics platform cannot see. Data quality checks should run on every load, testing required fields, duplicate keys, timestamp order, accepted validation_state values, and valid account mappings, and failed checks should create named incidents with assigned owners. The contract should also name the business owner. Product owns the meaning of the event, engineering owns emission, data owns transformation and testing, and revenue operations owns activation inside CRM and customer success tools.
The stronger architecture links four data planes
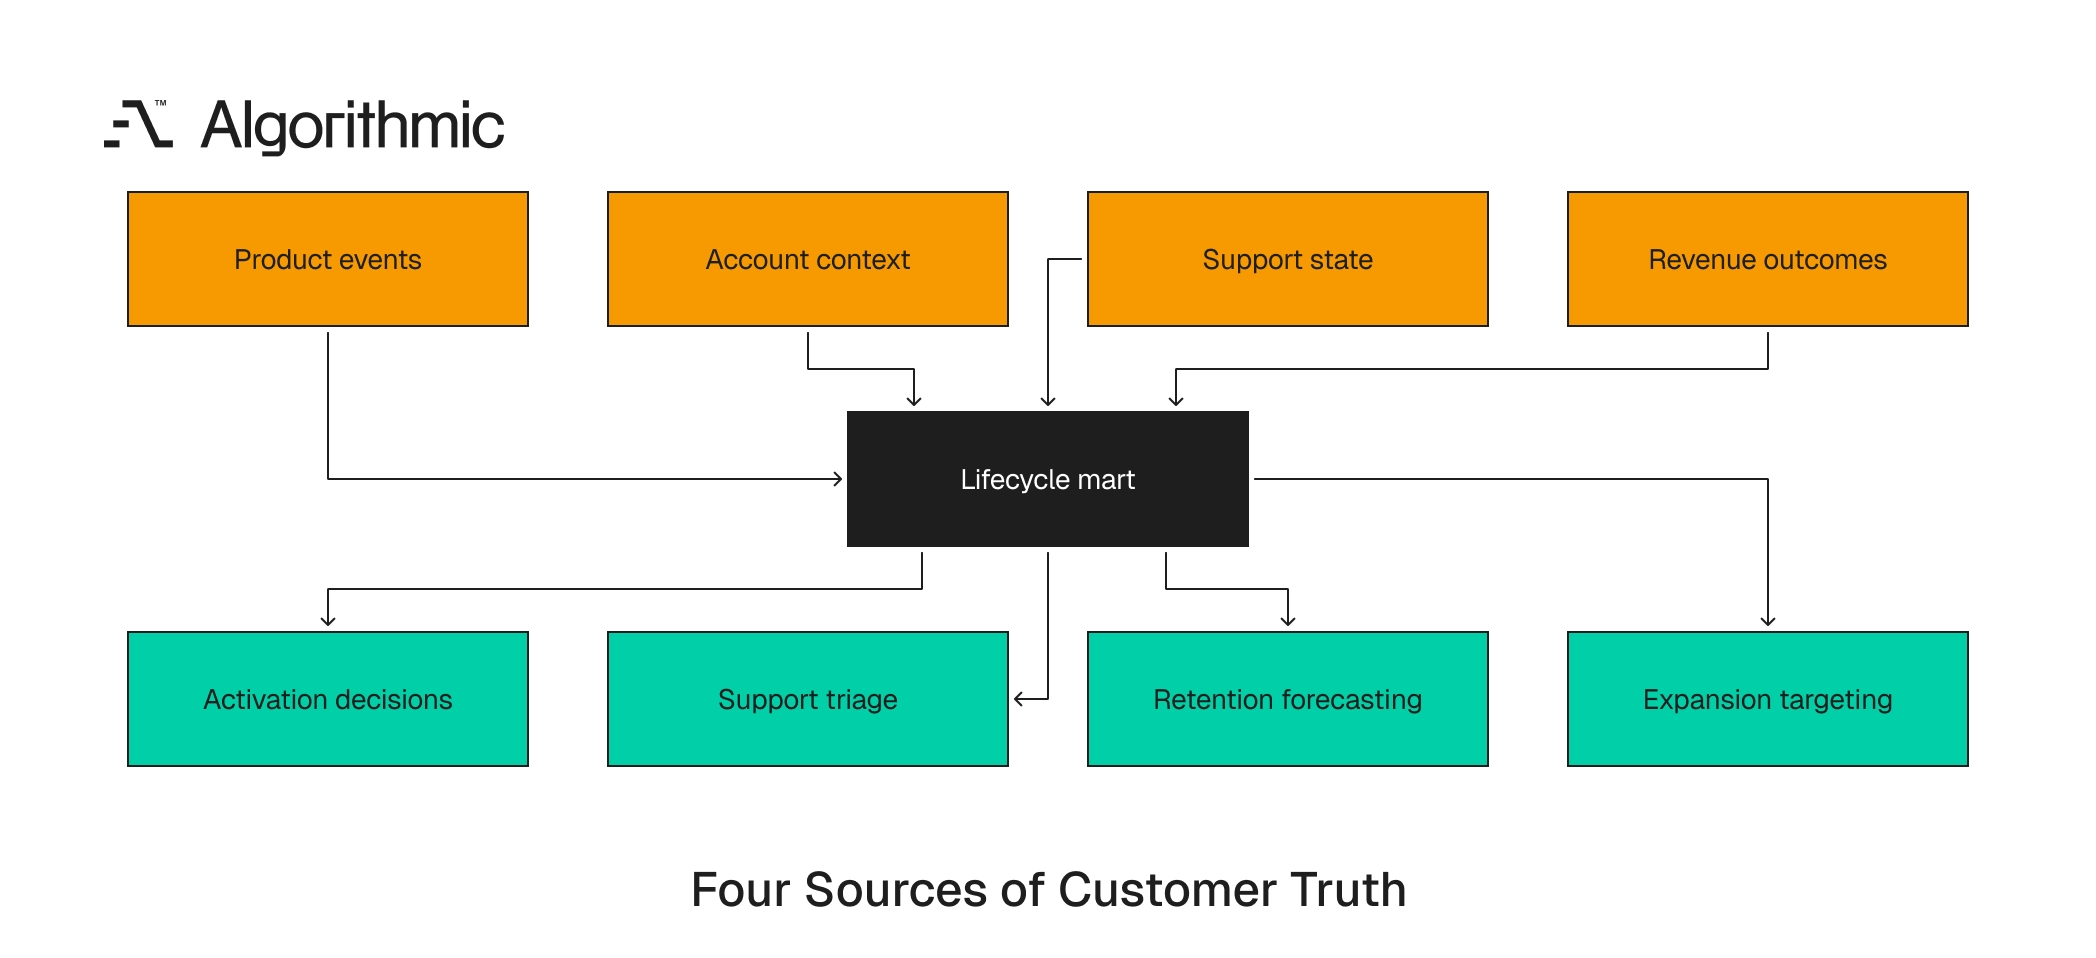
Customer analytics platforms become operationally useful when they combine four data planes, which are product events, account context, support state, and revenue outcomes. Each plane answers a different question, and together they give teams a shared operating model.
 Click to expand
 Databricks has written about the need for a customer context layer for real-time decisioning, and the same principle applies to lifecycle analytics. The value moment has limited use if it stays isolated inside product analytics. A platform that stops at event tracking gives product managers a partial view, while a platform that connects events to accounts, tickets, and revenue gives executives an operating system. The difference appears during weekly reviews, renewal calls, and incident escalation.
The architecture does not need a large replatforming program. Most companies can build the first version on an existing warehouse with dbt models, warehouse-native activation, and a clean identity layer, and the harder work is agreeing on the event that proves value. The data planes should have different owners and one shared contract. Product events should come from systems that know the outcome, and account context should come from the canonical account model, usually tied to CRM and billing. Support state should come from the case system, defect tracker, and customer communication history, and revenue outcomes should come from billing, CRM opportunities, contract records, and finance-approved ARR logic. The lifecycle mart should join these planes with point-in-time discipline.
Product events identify realized value
Product events show what users did and what outcomes occurred inside the product. This plane includes activation events, collaboration events, feature use, errors, latency, and completion states. The value moment should be emitted from the most authoritative system, since a backend service, job orchestrator, payment processor, or workflow engine is more reliable than the browser. Client-side tracking helps journey analysis, while server-side tracking is better for value confirmation.
For ML or AI products the event should also record model state where needed. A recommendation system can track first_recommended_item_purchased, a retrieval augmented generation product can track answer_accepted_with_source_opened, and a computer vision product can track inspection_completed_with_human_confirmation. A fraud platform can track first_blocked_transaction_confirmed_by_ruleset, and a customer service AI product can track first_agent_response_accepted_without_rewrite. Model version matters too, so if value completion falls after a model release the analytics platform should expose that break within one business day. Product and ML teams need a path from model version to customer outcome, alongside offline evaluation metrics.
This requires disciplined metadata. The event should include model version, ruleset version, prompt template ID, or workflow version when those objects affect customer outcomes, because without that metadata teams debate causes after customer metrics decline. AI products need especially strict acceptance rules, since a generated answer does not prove value until the customer accepts it, copies it, publishes it, or uses it in a downstream workflow. The event should record that acceptance state.
For workflow products, completion state matters more than screen state. A task viewed by ten users can still be blocked, while a task approved by the required external reviewer shows the promised workflow outcome. For data products, downstream use matters, so a pipeline that runs once without a query, alert, dashboard, or API consumer has limited business meaning. The value event should capture the downstream object that consumed the data.
Account context explains who the value belongs to
Account context connects users to companies, plans, seats, regions, contracts, and implementation status. Without this plane a platform cannot distinguish a free trial user from an enterprise administrator, and this is where many customer analytics builds fail. Event tables carry user_id, billing tables carry account_id, CRM records carry company_id, and support systems carry organization_id, so identity resolution becomes a side project that blocks every operating report.
A practical account model needs one canonical account identifier mapped to CRM, billing, product, and support systems. The mapping table should be versioned, and merges, acquisitions, workspace transfers, and domain changes must preserve history. The model should also separate user identity from account membership, because a consultant, agency partner, or system integrator can belong to several customer accounts, and treating that person as one customer corrupts activation, retention, and expansion analysis.
The account table should include effective dates, relationship type, source priority, and merge history, and it should support point-in-time reporting so a renewal analysis from March uses the account structure that existed in March. This discipline matters during acquisitions, since a company that buys another customer should inherit future commercial responsibility while historical product value stays tied to the account that received it.
Account context also needs segmentation fields that match operating decisions. Plan tier, ARR band, contract type, implementation model, region, and sales motion should all be available at event time, so analysts do not rebuild these joins for every retention question. The canonical model should define account hierarchy, because a global enterprise can have one master contract, twelve regional subsidiaries, and forty product workspaces, and lifecycle reporting needs both workspace-level activation and parent-level commercial exposure. Point-in-time account logic protects trend accuracy. If a customer upgrades from USD 48,000 ARR to USD 180,000 ARR in June, a March activation cohort should retain the March commercial context, since retrospective rewriting damages cohort analysis.
Support state shows friction and urgency
Support state adds open tickets, severity, last contact, customer effort, escalation status, defect links, and recent error counts, and this plane changes how frontline teams act. A support agent should see lifetime value, plan tier, last value moment, recent usage, and last 24-hour error count in the same panel. An enterprise customer with USD 240,000 ARR, three open severity-2 tickets, and no value event in fourteen days needs a different response from a free workspace with a single login issue.
The CallMiner 2025 CX Landscape Report finds that most organizations struggle to align customer experience data across departments, which limits their ability to turn feedback into action. One common reason is separation between support systems and product state. The data exists, and the agent view does not use it. The support view should show reason codes, not scores alone. “No confirmed value event in 14 days” gives the agent an immediate line of inquiry, while “Health score 61” forces the agent to open another dashboard.
Support context also protects engineering time. A severity-2 ticket from an account that never reached value belongs in an activation and configuration review, while a severity-2 ticket from a long-running account with declining value frequency needs product defect analysis and executive communication. These cases require different owners, since support can triage and communicate while product and engineering diagnose broken flows, missing instrumentation, or defects that block value. Support data should also distinguish customer effort from internal handling effort, because five emails from an agent do not show resolution. A restored value event, a closed blocker, or a renewed pattern of product use shows customer progress.
The support plane should include defect linkage. If eighteen accounts have the same open bug and seven have no value event, engineering should see revenue exposure beside defect count, which prevents low-volume, high-commercial-risk defects from being missed. Support leaders should also track time from case open to restored value, since time to first response measures service speed while time to restored value measures whether support returned the customer to the product outcome they bought.
Revenue outcomes close the operating loop
Revenue outcomes connect activation and engagement to expansion, downgrade, churn, and payment behavior. This plane includes ARR, MRR, plan tier, renewal date, invoice status, seat growth, contraction, discounting, and sales stage. The purpose is decision quality. A revenue operations team should know whether accounts that complete the value moment within seven days renew at a higher rate than accounts that complete it after thirty days, and a product leader should know whether a new onboarding flow increases value completion among accounts above USD 50,000 ARR. A data team should know whether value moment events predict support load or expansion pipeline, finance should know whether value completion varies by contract size or discount level, and sales should know which trial accounts have reached the usage pattern associated with paid conversion.
Revenue data also creates guardrails for prioritization. A low-ARR account with high activity can inform product design, while a high-ARR account with declining value frequency requires executive attention before the renewal process starts. The revenue plane should support cohort comparisons by acquisition channel, sales motion, implementation model, and discount band, since those cuts expose problems hidden inside blended retention metrics. A product can look healthy in aggregate while a high-ARR segment fails to reach first value.
Commercial teams also need timing fields. Renewal date, next invoice date, expansion opportunity stage, and contract start date determine urgency, and the same product signal has different meaning 300 days before renewal and 30 days before renewal. Revenue data should also include discounting and payment status, because a highly discounted account that never reaches value can signal poor qualification, and a full-price enterprise account with delayed payment and low value frequency needs commercial review before renewal.
Usage-based products require metering linkage. Value frequency should be compared with consumed units, committed spend, overage, and burn rate, since a customer can show strong value and weak revenue capture if pricing does not match product consumption. Sales compensation rules can distort behavior if value data is weak, so a CRM stage change should not count as customer progress. Confirmed value moments give revenue leaders a cleaner basis for expansion timing and customer health.
Value moment instrumentation changes four operating decisions
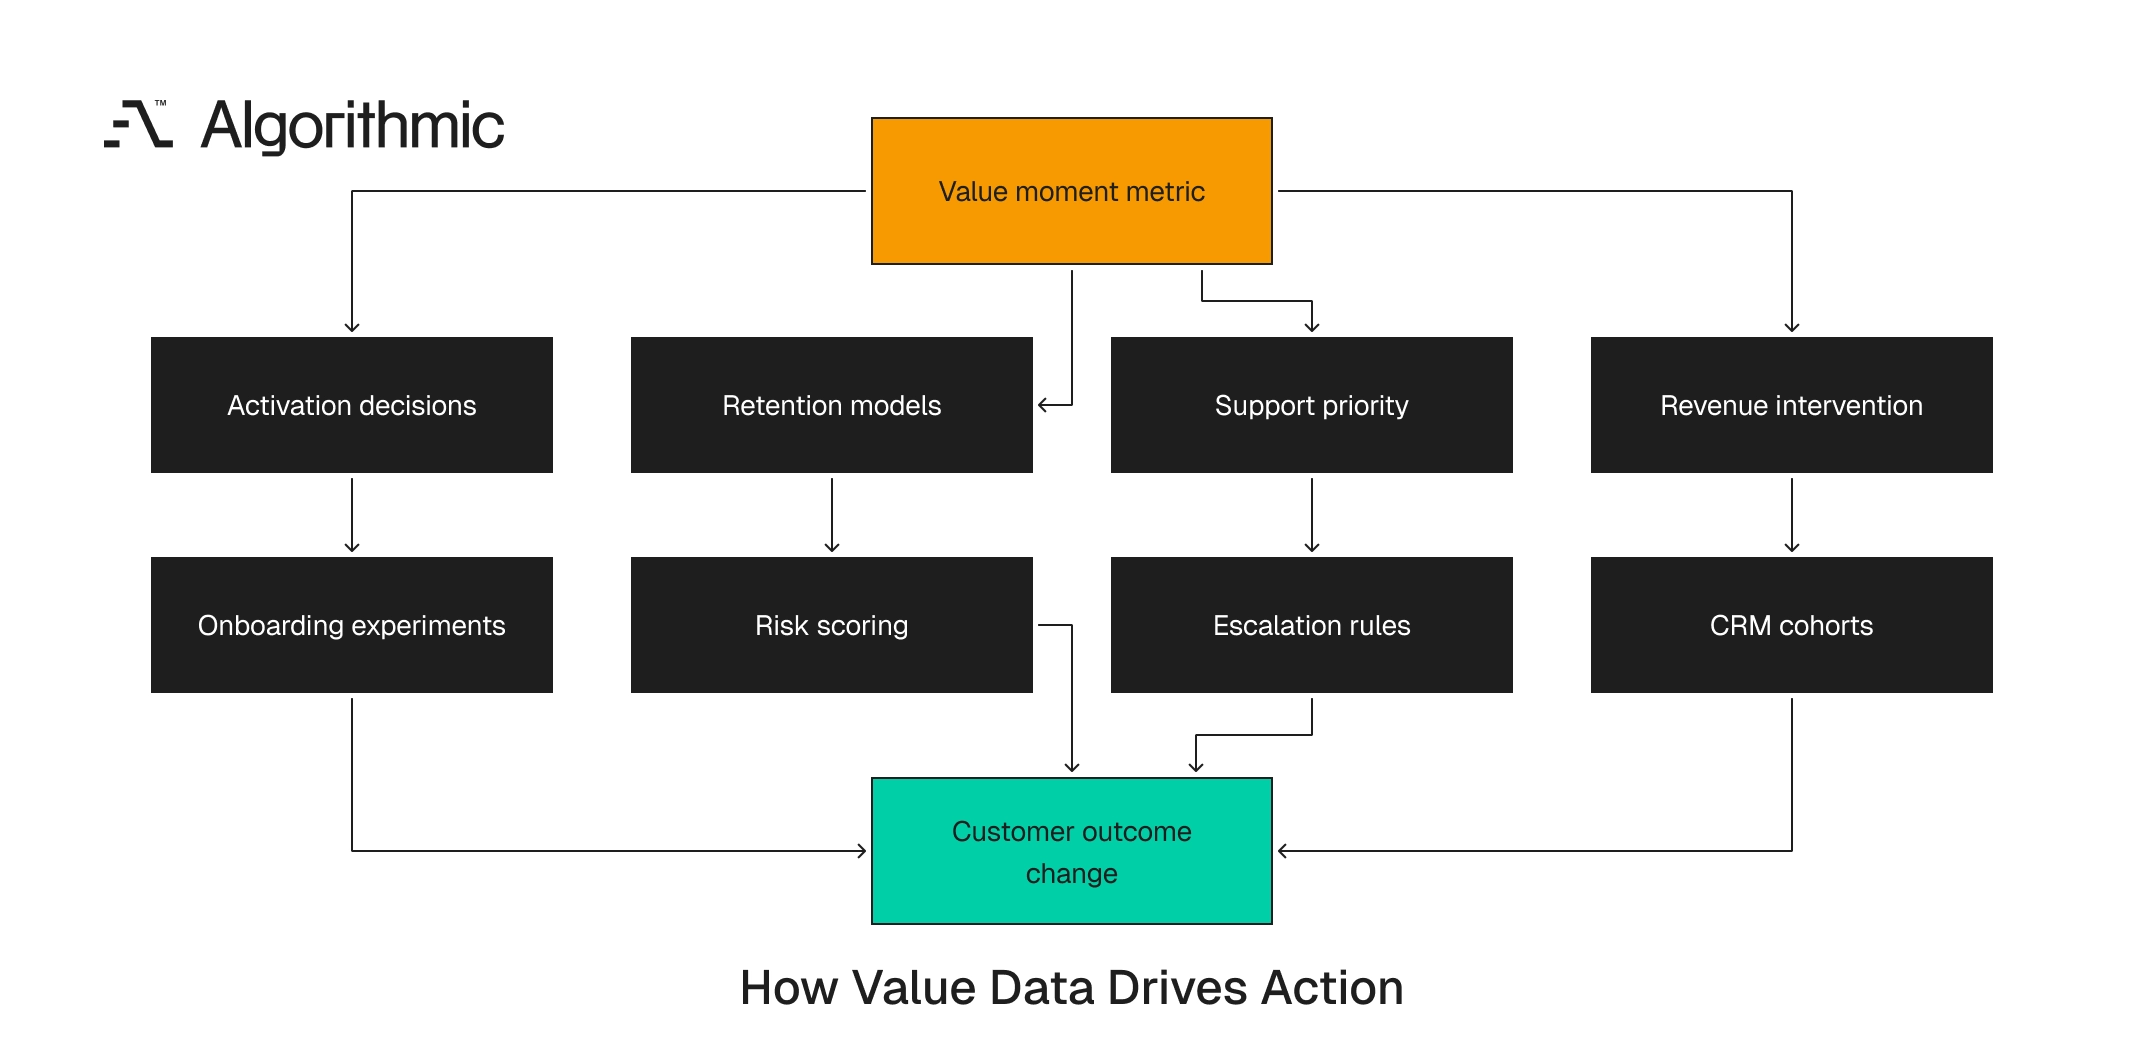
The value moment becomes useful when it changes what teams do, and four decisions improve first, which are activation, retention, support priority, and revenue intervention.
 Click to expand
 Each decision needs a specific operating rule that names the value event, time window, threshold, owner, and response. Without that discipline the metric becomes another dashboard tile. The strongest customer analytics platforms push value state into the systems where teams work, so product teams get experiment readouts, support teams get case context, and sales and customer success teams get CRM fields and account lists with reason codes.
A useful rule has a named trigger and a named owner. “Review accounts with no confirmed value event by day 14” is specific, while “Watch engagement risk” leaves too much interpretation. Operating rules should also define escalation rights. If support sees a blocked USD 250,000 ARR account with no value event, the agent should know who can approve engineering review, and if revenue operations sees a high-fit trial with repeated value events, the team should know which sales queue receives it.
Activation becomes outcome-based
Activation should measure the share of new users or accounts that reach the value moment within a defined time window. For a self-serve SaaS product the window can be 24 hours, and for an enterprise data platform it can be 30 days. A useful activation metric has this form.
activation_rate = accounts_with_confirmed_value_event_by_day_14 / eligible_new_accounts
This is stronger than counting users who completed onboarding screens, and it gives product teams a clean A/B testing target. If onboarding variant B increases value completion from 28% to 36% across 1,200 new accounts, the experiment has business meaning. The denominator matters, so eligible accounts should exclude test workspaces, internal domains, suspended accounts, and accounts without required permissions. A clean denominator prevents activation metrics from moving because of billing cleanup or QA traffic.
The activation window should match the buying motion. A collaboration tool with self-serve signup should measure hours or days, while a security platform with procurement, configuration, and data import should measure weeks. Activation reporting should also separate user-level and account-level outcomes, since in B2B products one active user rarely proves account value. The account may need three departments, five approved workflows, or one production integration before the customer receives the promised outcome.
The metric should show time to value by cohort, because median time to value identifies onboarding friction faster than monthly activation rate. The distribution matters, since long tails usually reveal implementation blockers, permissions issues, or data import failures. Activation teams should review failed paths with the same attention as completed paths, because a funnel step can show a 72% completion rate and still hide the wrong failure. Reason-coded failure events show whether customers stall because of permissions, data import, missing templates, or unclear workflow ownership. Activation also needs segment discipline, since a 14-day threshold can fit self-serve teams and fail enterprise accounts with security review. Each primary segment should have one threshold tied to its buying and implementation motion.
Retention models gain an early signal
Engagement at event granularity is the earliest signal of retention and monetization, and cohorts that reach value quickly behave differently from cohorts that remain active without completing the value event. This is the same pattern behind completed workflows and SaaS retention, where the users who finish the full workflow every week are the ones who renew. A retention model should include value moment timing, frequency, recency, account size, plan tier, support state, and implementation status. A first model can start with logistic regression or gradient boosted trees, and the first version should be explainable enough for product and revenue teams to trust.
Speed matters. If a team cannot trace a user action to a churn or revenue signal within days, it cannot detect product-market fit drift on the current cohort, and quarterly retrospective analysis arrives too late for intervention. Retention models should separate first value from continuing value, since first value proves that onboarding worked while continuing value shows whether the product became part of the customer’s operating rhythm. A data observability platform can track the first monitored pipeline with an alert acknowledged, and it should also track weekly monitored pipelines, alert response time, and recurring dashboard usage. The first event predicts activation, and the recurring pattern predicts renewal confidence.
The model should expose drivers in plain language, so “No confirmed value in first 21 days” is a better account note than “risk percentile 82”. Teams act faster when the model returns the operational reason. A retention model also needs holdout discipline, because if every high-risk account receives intervention the team loses a clean read on intervention quality. A small control group, governed by revenue leadership, helps separate prediction quality from playbook quality.
The model should also account for seasonality. Education software, tax platforms, retail planning systems, and HR tools have usage rhythms tied to external calendars, so continuing value frequency should be judged against the customer’s expected operating cycle. Model governance should stay practical. A weekly report should show prediction distribution, top drivers, false positives, false negatives, and intervention outcomes, since the goal is better decisions, not a black-box risk score.
Support priority becomes evidence-based
Support queues often use severity, arrival time, and customer tier, and adding value moment state improves triage. An account that has not reached value deserves a different support motion than an account that reached value 90 days ago and now faces an isolated defect, because the former is an activation risk and the latter is a service quality issue. Support tooling should expose this state directly, so agents do not search four systems to understand whether the customer is active, blocked, high value, or near renewal. Product state and commercial state belong inside the support view.
A practical triage rule can be written in one line. Escalate any paid account above USD 100,000 ARR with no confirmed value event in 14 days and an open severity-2 ticket, since that rule is auditable, teachable, and easy to test. Support leaders should review these cohorts weekly with product and customer success, and the review should distinguish product defects, onboarding failures, account fit issues, and configuration delays. Each category has a different owner and response.
Support instrumentation should include case outcomes, tracking whether a case led to first value, restored value frequency, or removed a blocker, since those fields help leaders measure whether support activity changed customer state. This approach also improves defect prioritization, because a defect affecting ten high-ARR accounts before first value deserves a different engineering response than a defect affecting inactive sandboxes. Severity and revenue exposure should appear in the same queue.
Support teams also need playbooks tied to value state. A no-value account should receive configuration checks, onboarding review, and workflow validation, while a mature account with lost value frequency should receive defect diagnosis, executive communication, and recovery tracking. The support manager should see queue exposure in dollars, because a view that shows 22 severity-2 tickets is incomplete while a view that shows USD 1.8 million ARR blocked before first value supports better staffing and escalation decisions.
Revenue intervention becomes cohort-specific
Sales and success teams need to know which accounts deserve human attention, and value moment instrumentation helps classify accounts by commercial potential and product state. A trial account with 20 invited users and no value event by day 5 needs onboarding help, a mid-market account with repeated value events across three departments can be ready for expansion, and an enterprise account with declining value frequency and rising support volume needs renewal intervention. The platform should push these cohorts to CRM and customer success tools with reason codes, since “No confirmed value event by day 14” is useful while “Health score declined” is too broad for precise action.
Cohort logic should distinguish absence of value from loss of value. A new account with no value event needs activation support, while a mature account with falling value frequency needs an executive conversation, product diagnosis, or service recovery plan. Sales teams also need positive signals, because an account that crosses the value threshold across multiple departments has internal sponsorship, and that pattern can support expansion outreach with evidence from product usage instead of anecdote from a single champion.
The same logic helps sales development teams qualify product-led leads. A trial account with repeated confirmed value events, multiple active users, and a paid integration connected has higher intent than an account with 50 logins and no outcome, so activity volume should not outrank proof of value. Revenue leaders should review these segments by source, since paid search, partner referrals, outbound, and product-led signups often reach value at different speeds, and those differences should shape budget allocation and sales motion design.
Customer success teams should also track handoff quality. If sales closes accounts that take 60 days to reach first value the handoff process needs review, and if accounts from one channel reach value twice as fast that channel deserves deeper investment analysis. Expansion playbooks should use value breadth, since one team receiving value shows adoption, three departments receiving value shows a stronger expansion case, and ten departments repeating value events across a quarter indicates an enterprise account with internal operating pull.
A practical instrumentation framework for customer analytics platforms
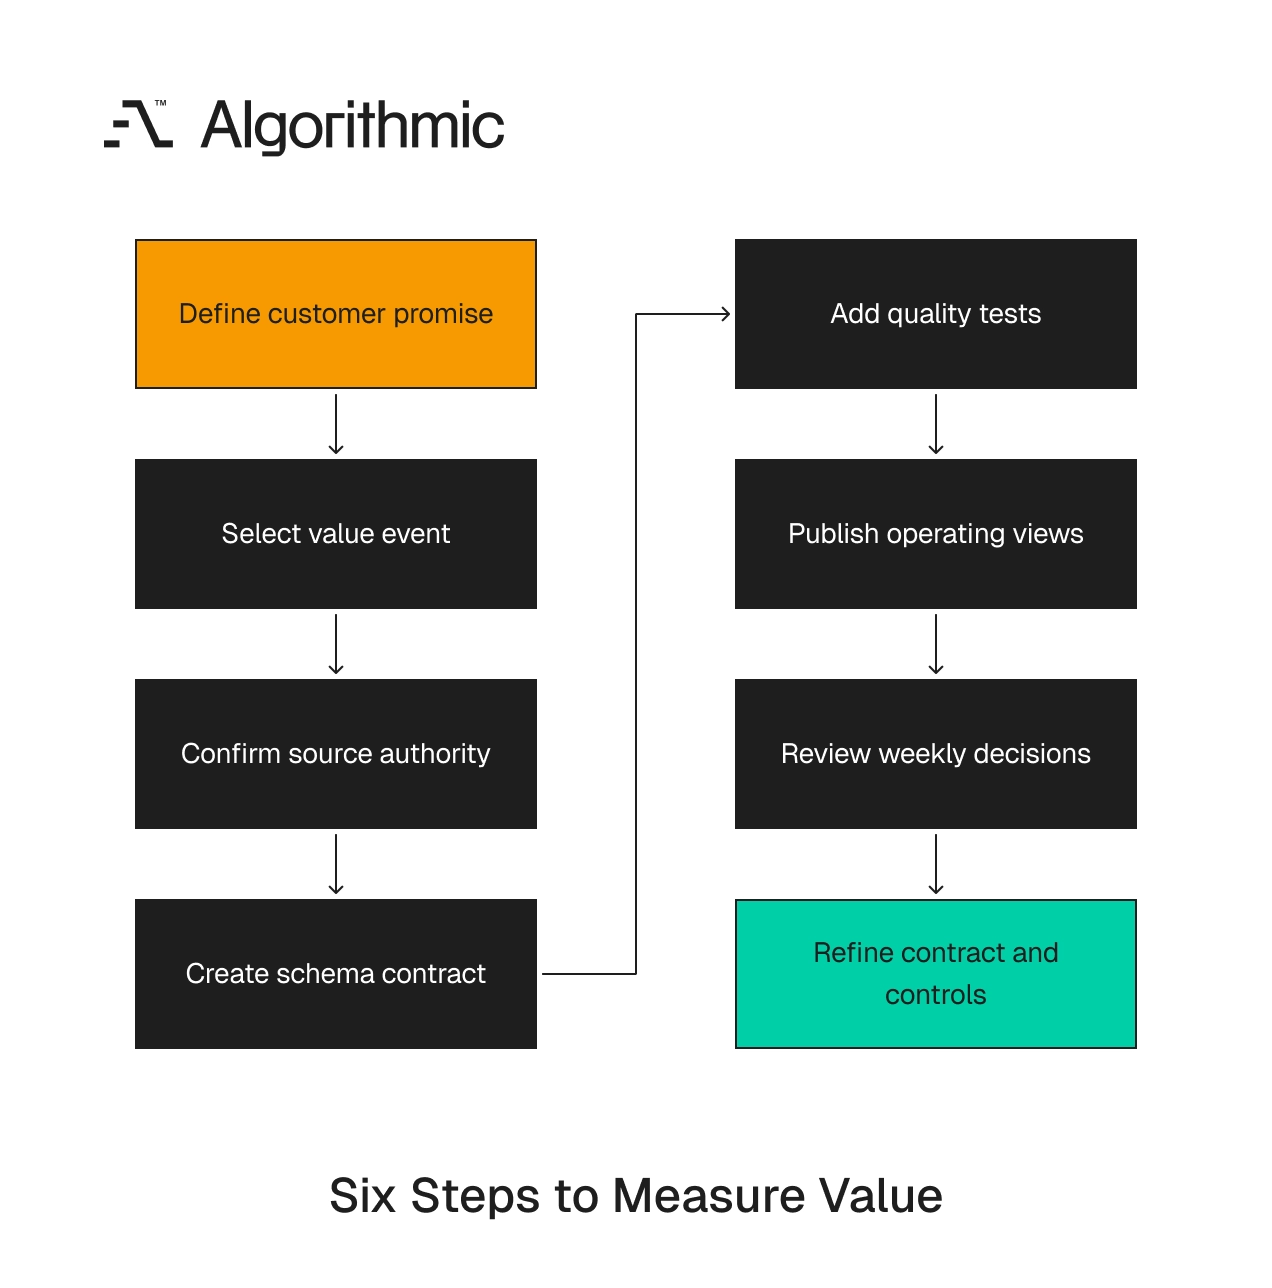
Engineering leaders need a framework that separates event design from data movement and operating use. The following 6-gate framework works for new builds and for data infrastructure and integrations work on top of existing warehouses.
The 6-gate value moment framework
| Gate | Decision | Required artifact |
|---|---|---|
| 1. Promise definition | What value does the product claim to deliver? | One-sentence value statement by customer segment |
| 2. Event selection | Which event proves that value occurred? | Event definition with positive and negative examples |
| 3. Source authority | Which system confirms the event? | Source-of-truth map |
| 4. Schema contract | Which fields are required? | Versioned event schema |
| 5. Quality control | How will false positives be detected? | dbt tests, anomaly checks, and ownership |
| 6. Operating use | Which teams act on the event? | Activation, support, retention, and revenue playbooks |
 Click to expand
 This framework prevents premature dashboard work, and it makes data engineering work more productive because the pipeline has a business target from day one. A data warehouse architecture for this model usually includes raw event tables, cleaned event models, account identity tables, support snapshots, billing snapshots, and lifecycle marts. Snowflake, BigQuery, Databricks, dbt, Fivetran, Segment, RudderStack, Hightouch, and Census can all support the pattern, so tool choice matters less than contract quality.
The architecture should also define ownership. Product owns the customer promise and event meaning, engineering owns event emission, and data owns transformation, quality tests, and lineage. Revenue operations owns CRM activation and cohort workflows, support owns case workflow adoption and escalation rules, and finance owns commercial definitions such as ARR, MRR, discount bands, and renewal timing.
The lifecycle mart should be designed for decisions, not browsing. Common tables include account_activation_state, account_value_frequency, support_risk_snapshot, and revenue_lifecycle_cohort, and each table should have a named owner and a documented refresh target. The first implementation should avoid broad metric catalogs, since a small mart with four tables and twelve trusted fields beats 40 fields that teams debate during every review. Production trust compounds faster than dashboard coverage.
The gates should run in order. Teams that start with tooling usually create polished reports with weak definitions, while teams that start with the customer promise create a smaller system with stronger operating value. The framework also gives executives a way to inspect quality, because a green dashboard with no source authority map deserves limited trust while a metric with source ownership, schema tests, and business tool activation can support operating decisions.
Common failure modes and technical controls
Value moment instrumentation fails in predictable ways, and the fixes are engineering controls, not dashboard revisions.
False positives from weak event triggers
A frontend click event often fires before value is delivered. Export clicks fail, invites bounce, jobs time out, and AI answers receive no user acceptance. The control is server-side confirmation, so emit the value event only after the outcome is complete, add a validation_state field, and track failed attempts separately. An invitation event should not count as value when the invited user never accepts, a report event should not count as value when generation fails or the recipient never opens it, and a pipeline event should not count as value when the job completes without downstream use.
Store the failed attempt event with its own name and reason code, since pipeline_run_failed_timeout and pipeline_run_completed_not_queried tell product teams where customers stall, and these events improve diagnosis without corrupting activation. False positives become expensive as the metric spreads, because once sales compensation, renewal forecasts, or board reporting use the value event, weak triggers create commercial distortion. Engineering controls should be in place before the metric enters executive reporting.
False positive reviews should happen before major reporting milestones. A 50-account manual sample can reveal whether the event matches the customer outcome, and the sample should include different plans, regions, acquisition channels, and implementation states. Teams should also track near-miss events, since a failed export, rejected invite, or timed-out job often explains activation problems faster than funnel charts. These events should inform product work without counting as realized value.
Identity gaps across product, billing, CRM, and support
B2B products often start with user analytics and later need account analytics, which creates inconsistent joins and misleading cohort counts. The control is a canonical account table with durable identifiers, so maintain mappings to Stripe, Salesforce, HubSpot, Zendesk, Intercom, and the product database, and treat identity resolution as part of the customer analytics platform. The account table should include effective dates, since a workspace transfer, acquisition, or legal entity change should not rewrite history. Historical value events must remain tied to the account structure that existed when the event occurred.
Data teams should test for unmapped accounts daily. A daily exception report should list product accounts with no CRM record, billing accounts with no product workspace, and support organizations without a canonical account, because these gaps block revenue and support decisions. Identity work needs operational ownership too, since someone must approve merges, resolve duplicates, and govern source priority, and without that owner unresolved identity issues accumulate until executives lose trust in the platform.
Identity issues also create false account health. A customer can look inactive because product workspaces sit under a different identifier than the CRM account, and another customer can look healthy because a consultant’s activity is counted across unrelated accounts. The canonical table should include merge history and survivorship rules, so Salesforce may win for legal name, Stripe may win for billing status, and the product database may win for workspace ownership. Those rules should be explicit and tested.
Event drift after product releases
Product teams rename flows, change backend services, and add new paths, and the old value event stops firing or starts firing under new conditions. The control is event testing in CI/CD, so add unit tests for event emission, dbt tests for required fields, and alerting for event volume anomalies. A 40% drop in value events after a deployment should page the data owner during business hours. Event drift also occurs when a new product path bypasses the old service, since a bulk import path can create the same customer outcome without firing the original single-object event. Release checklists should require event coverage for every path that produces the value outcome.
Versioning helps teams manage intentional change. If the event definition changes materially, publish value_event_version and keep old and new versions comparable during a transition period, because finance and revenue teams should not discover definition changes during monthly reporting. Product analytics reviews should include instrumentation coverage, since every release that changes onboarding, permissions, billing, integrations, or workflow completion can affect value measurement. Treat those changes with the same care as API changes.
Drift detection should include both volume and composition. A stable event count can still hide a broken segment if enterprise events fall and self-serve events rise, so segment-level anomaly checks catch problems before aggregate metrics mask them. The release owner should document value event impact, and a one-line checklist item is enough, such as asking whether the change creates, alters, or bypasses the value moment path. That question prevents weeks of downstream repair.
Dashboard fragmentation by function
Product, success, support, and revenue teams often build separate dashboards with separate health definitions, and the organization then debates metrics during operating reviews. The control is one lifecycle mart with shared definitions, so teams can have different views but not different activation logic. A shared mart does not require one dashboard for every team, since product needs funnel and experiment views, support needs case-level context, and revenue needs account lists, renewal cohorts, and pipeline overlays.
Governance should be practical. A data owner should publish metric definitions, field lineage, freshness targets, and known exclusions, and operating reviews should reference the same metric names used in the warehouse and business tools. The cadence matters as much as the model, because if teams review product metrics on Monday, support escalations on Wednesday, and renewal risk on Friday with separate data cuts, alignment erodes. One lifecycle mart gives each meeting the same source of truth.
Fragmentation also creates political cost. Teams defend their dashboards because each one reflects local incentives, and a shared value event moves the discussion from metric ownership to account decisions. The lifecycle mart should expose certified fields, so business users know which fields are approved for operating reviews and compensation logic. Experimental fields can exist, provided they are labeled and kept out of executive reporting.
Metric adoption stalls inside business tools
A value event has limited effect when it stays inside the warehouse. Frontline teams act inside Salesforce, HubSpot, Zendesk, Intercom, Gainsight, Catalyst, Slack, and email, so the metric must reach those systems with enough context to guide decisions. The control is warehouse activation with reason codes and refresh targets, since a CRM field named no_value_event_by_day_14 is more useful than a dashboard link, and a support panel that shows last value date, ARR, and open defects is more useful than a weekly export.
Sync failures should be monitored like pipeline failures. If Salesforce stops receiving value fields for three days, sales and success teams lose operating signal, so data teams should track sync freshness, rejected records, permission errors, and field-level null rates. Adoption also needs manager inspection, because if customer success managers ignore the cohort list the metric will remain a data artifact. Weekly pipeline and renewal reviews should require reason codes from the value model.
Business tool fields should be sparse and specific. A CRM account page with 30 analytics fields will be ignored, while five fields with clear definitions can change account planning within one quarter. Those fields should include the last confirmed value date, days since last value, first value completion status, threshold flag, and current reason code, and each field should have a documented refresh target that matches the operating cadence of the team using it.
A 30-day implementation plan for existing platforms
A team can make meaningful progress in 30 days without replacing its analytics stack. The work requires one product lead, one data engineer, one backend engineer, one revenue operations owner, and one support or success leader. The plan works best when the team starts with one product line and one customer segment, because broad programs stall since each segment has a different promise, while narrow scope produces a working contract, a validated event, and one operating cadence.
The 30-day target is a production value event connected to account, support, and revenue state. A complete customer intelligence system can come later, and the foundation should prove that one event changes operating decisions. The team should also set executive sponsorship before the first workshop, since a COO, CPO, CRO, or CTO should approve the selected segment and the decision cadence, and without a senior owner the work becomes another analytics project.
Days 1 to 5 define the value moment
Select one product line and one primary customer segment, write the value promise in one sentence, and identify three candidate events tested against recent account history. The selected event should meet four tests, since it occurs within the activation window, it correlates with retention or expansion, it can be confirmed by a source system, and it can be explained to sales and support teams in plain language. Review 20 recent customer journeys during this phase, including converted trials, failed trials, renewed accounts, and churned accounts, and the sample will expose events that look attractive in a funnel and fail as proof of value.
Document positive and negative examples. For a workflow product, an approval completed by an external reviewer can be positive while an internal user opening the approval screen should be negative. These examples reduce ambiguity for engineering and analytics teams, and they help sales and support teams understand why the metric matters, since a value moment that needs a long explanation will fail in daily operations. The product lead should write the promise without internal terminology, so a phrase like teams reduce invoice approval time is clearer than users configure automated workflow nodes, because the first describes the customer outcome and the second describes product mechanics. The data engineer should assess whether candidate events exist in raw data, plan backend instrumentation if the event exists only as a frontend click, and name the join key in the contract if the event requires two systems.
Days 6 to 15 instrument and validate
Add or repair the server-side event, define the schema, and create tests for required fields, duplicate events, invalid account IDs, and delayed ingestion. Backfill 90 days of event history where possible, compare value moment completion by cohort, acquisition channel, plan tier, and account size, and check a sample of 50 accounts manually to estimate false positives and false negatives. Validation should include timing checks that confirm the event occurs after the outcome and confirm delayed jobs, retries, and idempotency rules do not create duplicate value events.
The data engineer should publish a short validation report with event volume, null rates by required field, duplicate rate, unmapped account rate, and examples of rejected events, and that report becomes the baseline for future quality checks. The backend engineer should document the trigger condition and source service, the product lead should approve positive and negative examples, and revenue operations should confirm that account and plan fields match business reporting.
The validation report should also include five customer examples, with at least two showing confirmed value and at least two showing failed attempts, since concrete examples help executives trust the metric faster than abstract lineage diagrams. If backfill quality is weak, label it, because historical reconstruction can help directional analysis while production decisions should rely on current confirmed events. Mixing reconstructed and confirmed events without labeling damages trust.
Days 16 to 25 connect account, support, and revenue state
Join the event to CRM, billing, and support data, and build account-level lifecycle tables with activation state, last value event, value frequency, open ticket count, renewal date, ARR, and plan tier. Push key fields into the systems where teams work, since Salesforce, HubSpot, Zendesk, Intercom, Gainsight, and Catalyst are common targets and a dashboard alone will not change frontline behavior. Define the fields with precision before pushing them, using names like confirmed_value_event_date, days_since_last_value_event, value_event_count_30d, and no_value_event_by_threshold_flag that a sales manager and support lead can interpret without a data dictionary.
Test the sync process with a small account set. Confirm that CRM fields update on the expected schedule, support views show the same values, and permissions protect sensitive revenue data, since operational trust depends on field accuracy and timing. The team should also define failure handling, so if the daily sync fails the owner knows before the weekly review, and if a field becomes null for more than 2% of paid accounts the data owner investigates the same day.
This phase should include one live support view and one live CRM view. The support view should show account ARR, last value date, open ticket severity, and reason code, while the CRM view should show threshold status, value frequency, renewal timing, and expansion signal. Revenue operations should verify that account lists match ownership rules, since a named CSM, AE, or support owner should exist for each account in the review cohort, and unassigned accounts should be treated as operating exceptions.
Days 26 to 30 set the operating cadence
Create three weekly reviews, an activation cohort review, a retention risk review, and a support priority review, and each review should use the same value moment definition. Track five metrics, which are value completion rate, median time to value, value frequency, accounts with no value event by threshold day, and renewal or expansion rate by value cohort, and retire metrics that do not change a decision. Each review needs an owner and a decision log, so the activation review assigns onboarding experiments and product fixes, the retention review assigns customer success outreach and product diagnosis, and the support review assigns escalation and defect follow-up. Every assigned action should include account owner, due date, expected state change, and next review date, since a meeting without a decision log produces no operating value.
The first month should end with a written operating standard that names the event contract, source system, quality tests, business tool fields, weekly meetings, and owners, and that document prevents the program from depending on one analyst or one executive sponsor. The first executive readout should show the cohort, the decision, and the account action. A sample readout can state that 43 paid accounts crossed day 14 without value, 12 have open severity-2 tickets, and 8 exceed USD 100,000 ARR, and that statement leads directly to ownership and next steps. The team should also list the next two product lines for expansion, since the second rollout should reuse the same contract pattern, identity layer, and business tool fields. The event definition will change while the operating discipline stays stable.
Measurement standards for production use
A value moment metric becomes reliable when it meets production measurement standards, and the standard should cover freshness, completeness, accuracy, and adoption. Freshness defines when the event becomes available for decision-making, so a self-serve product can require hourly updates while an enterprise implementation motion can use daily updates. The target should match the speed of customer intervention, since daily freshness is acceptable if support can recover an account within 24 hours, and hourly freshness is required if a trial converts or churns within 48 hours.
Completeness measures whether all eligible events arrive with required fields, because a value event with no account_id cannot support B2B lifecycle analysis and a value event with no source_system weakens audit and debugging. Accuracy measures whether the event reflects the promised outcome, and manual review remains useful early in the program, since a monthly sample of 50 to 100 accounts can catch silent drift that automated tests miss. Adoption measures whether teams use the metric in decisions, because if support agents do not see the field support behavior will not change, and if customer success managers do not receive cohort lists renewal intervention stays anecdotal.
These standards convert instrumentation into operating discipline, and they give executives a clear view of data maturity, since a metric with high volume and low adoption is instrumentation debt. A production metric also needs retirement rules, so if the product promise changes the old value event should be versioned, deprecated, or replaced through a governed process, because silent metric replacement destroys trend integrity. Measurement standards should appear in the same place as the schema contract, stored in version control, published in the data catalog, and referenced in operating reviews, and the standard should be short enough that product, engineering, support, and revenue leaders read it.
Production standards should include ownership response times. A failed schema test should have a named owner and a target repair window, and an unmapped account spike should route to the owner of the canonical account table. The standards should also define acceptable lag, since a daily metric that arrives at 11:00 p.m. cannot support an 8:00 a.m. support standup, so freshness targets should align with the meeting that uses the metric. Accuracy should include business review, not only data tests, because a CSM can identify a false value event that automated checks accept, so monthly review samples should include product, support, data, and revenue operations. Adoption can be measured through business system usage, tracking whether CRM cohort fields appear in account plans, whether support agents view the value panel, and whether renewal reviews use the reason codes. These adoption signals show whether the metric has entered the operating system.
Executive operating model
Value moment instrumentation succeeds when executives use it to run the business, so the metric should appear in weekly operating reviews, monthly revenue reviews, and product investment decisions. The executive review should answer four questions, which are which new accounts reached value, which paid accounts lost value frequency, which high-ARR accounts are blocked by support or implementation issues, and which accounts show enough confirmed value to justify expansion outreach. That fourth question connects product truth to revenue action.
The operating model should assign clear ownership. The CPO owns product experience and activation, the CRO owns commercial intervention and expansion motion, and the COO or VP of Customer Success owns renewal risk and support coordination. The CTO owns instrumentation quality and platform reliability, the data leader owns lineage, testing, and metric publication, and finance owns revenue definitions and cohort reporting. These roles should meet around the same customer list, because if each function brings its own list the review becomes a negotiation, while if the lifecycle mart produces the list the review becomes a decision forum.
The board view should stay concise. Report activation rate, median time to value, continuing value frequency, renewal rate by value cohort, and high-ARR accounts with no recent value, since five measures are enough for governance when definitions are trusted. Executives should also inspect movement between states, so new accounts move from eligible to first value, and mature accounts move from continuing value to expansion readiness or from declining value to recovery. State movement creates a clearer operating view than static engagement charts.
A weekly executive review should end with account actions. The team should know which accounts receive onboarding intervention, executive outreach, defect escalation, or expansion sequencing, and the decision log should record owner, due date, and expected customer state change. The board should see trend quality, not dashboard volume, so a concise board slide can show the number of accounts reaching value, the median time to value trend, and retention by value cohort. Directors can then inspect whether product investment changes customer outcomes.
Build the platform around the event that proves value
Customer analytics platforms should report activity, context, friction, and revenue from a shared data model, and the value moment is the anchor event that makes those signals coherent. Product leaders gain a better activation target, revenue operations teams gain cleaner lifecycle cohorts, and support teams gain customer state at the point of triage. Data engineers gain a clear contract for pipeline design, and executives gain a shared operating view of which customers received value, which customers are blocked, and which customers are ready for expansion.
Start with one product line this week, define the value moment in one sentence, and instrument it from the authoritative system. Join it to account, support, and revenue data, push the result into Salesforce, HubSpot, Zendesk, Intercom, Gainsight, or the tools where teams already work, and review the cohort every week until the metric changes decisions. A customer analytics platform that cannot answer which customers received value this week is unfinished. Build that answer into the data model, the business tools, and the operating cadence, then use it to run activation, retention, support, and expansion with evidence.
Algorithmic builds data analytics and business intelligence systems that put the value moment at the center of the model, from event contract to warehouse to the tools your teams already use. Start a conversation if your platform counts activity but cannot yet prove which customers received value.