

A 150-engineer software organization can spend weeks investigating a revenue, funnel, or quality metric that moved for reasons no dashboard can explain. The investigation starts in Looker, Tableau, Power BI, Grafana, or a warehouse query, and it ends in Slack threads, Jira exports, deployment logs, support tickets, application traces, and one-off SQL. The delay comes from a structural defect in the operational analytics platform, where the organization retained the summary and discarded the event history. The dashboard shows a number, but the platform lacks the record required to explain it.
Operational analytics needs raw bug reports, deployments, failures, user actions, assignments, timestamps, and pipeline decisions. Without that record, leaders cannot separate real performance from definition changes, filter changes, or lost data, and they inherit a reporting dispute instead of an operating fact. This is a question of data infrastructure, not dashboard polish, because the record either exists at the source or it does not.
The cost reaches the executive team fast. A VP of Product delays a release decision because the activation chart lacks assignment records, and a CFO questions a revenue improvement because the dashboard excludes failed invoices without preserving the original payment events. This failure appears after a metric has already influenced decisions, so by the time leadership questions the number, teams have already shifted roadmap scope, staffing, quotas, or release timing. A missing event record turns a measurement issue into a management delay.
Filtered dashboards create management blindness
Operational dashboards give leaders concise answers, whether defect closure rate, deployment frequency, incident count, activation rate, trial-to-paid conversion, revenue leakage, or support backlog aging. Those answers lose value when the dashboard stores only filtered, transformed, or aggregated records, so the most polished chart in an executive meeting can become the least useful artifact during an incident. A narrow record set creates confidence before the team has earned it.
A defect dashboard that reports “96% fixed defects” has limited value if raw bug reports were classified before ingestion. A deployment dashboard that excludes hotfixes gives a different operating picture from one that preserves every production change, and a funnel dashboard that removes “invalid users” before raw event storage cannot later prove whether conversion improved or invalid-user classification changed.
The failure mode is common because filtered data feels orderly. Teams remove test accounts, internal users, duplicate events, low-volume paths, malformed payloads, bot traffic, sandbox activity, and edge cases before durable storage, and each exclusion has a reasonable local explanation. The aggregate result is a reporting system that cannot answer exclusion questions, and during normal reporting cycles that weakness stays hidden. During a board review, revenue incident, or customer escalation, it becomes an operating constraint.
A common pattern appears in SaaS companies with self-serve signup. The product dashboard excludes free email domains, suspicious IP ranges, internal tenants, and incomplete profiles, and six months later the company cannot prove whether enterprise conversion improved or filters removed a growing segment of low-intent users. The same pattern appears in engineering operations, where a release dashboard excludes rollback deployments so the release team can report a stable deployment-frequency metric. During an incident review, leaders need the rollback sequence, the affected services, and the timestamps that the dashboard removed.
The excluded population matters during incidents
Operational analytics has the highest value during unexpected movement. A funnel drops 12% after a release, payment failures rise from 0.8% to 2.3%, defect reopen rate falls by 40% after a process change, or a revenue dashboard shows improvement while support volume rises. Each pattern requires event-level review, not chart-level debate, because leaders need to reconcile the measure with the underlying operating reality. They need to know which events entered the metric, which events were rejected, and which events arrived late, and a chart without those answers slows incident response.
Filtered dashboards show the accepted record set, but incident response also requires the rejected record set. That includes events dropped for schema errors, events delayed beyond service thresholds, duplicate events removed by idempotency logic, and events discarded because a user segment was excluded. A dashboard without raw event preservation can show an orderly trend, but it cannot prove the trend represents operating performance, and that difference matters when leaders must decide whether to roll back a release, change a process, or restate a metric.
The same issue appears in engineering quality reporting, where a team can reduce reported defects by excluding tickets without customer impact. The executive question remains whether product quality improved or whether the classification rule changed. Take severity reassignment, where support may reclassify defects from “customer-impacting” to “usability issue” after a taxonomy update. If the original ticket events remain available, leaders can compare both taxonomies over the same reporting window, but without that record the team reconstructs history from ticket comments and memory. That reconstruction consumes analyst time, produces weaker evidence than the original event stream, and leaves finance, product, and engineering with competing explanations.
Raw events are the audit log for business metrics
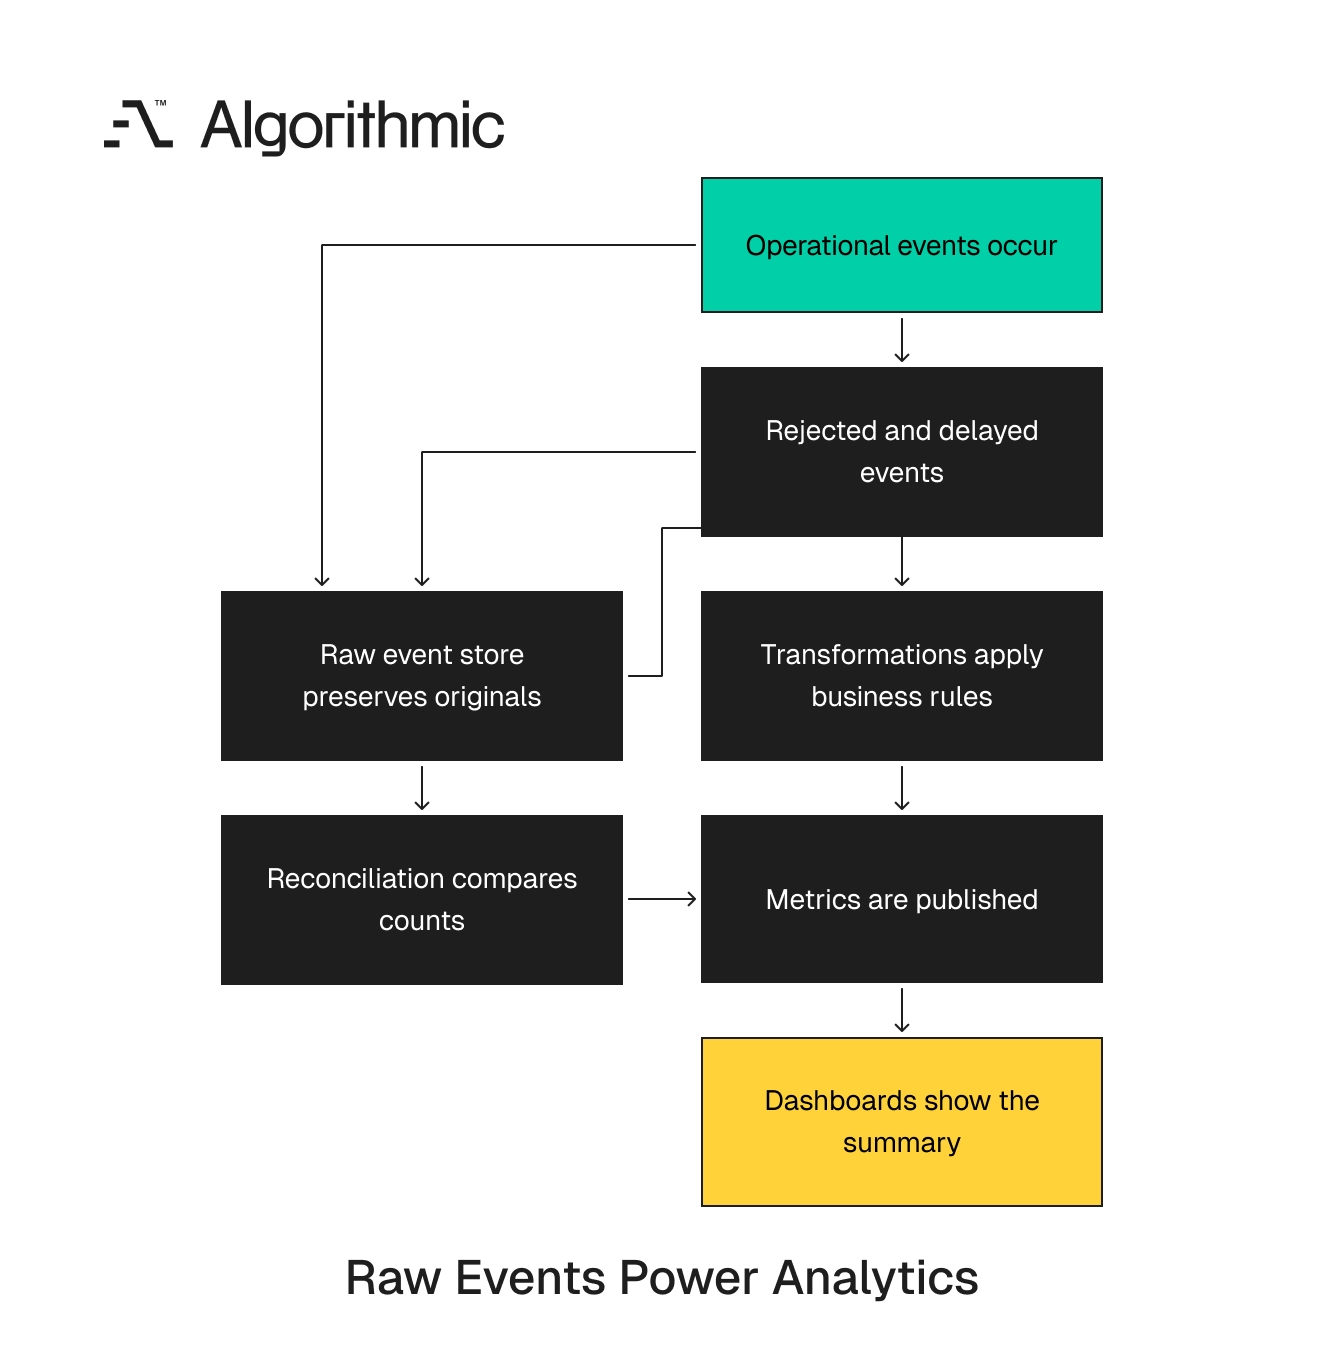
A raw event is the original record of something that happened, stored before business rules reshape it. In an operational analytics platform, the system preserves payloads for user actions, deployments, bug reports, failures, workflow transitions, support interactions, and revenue events, and that record gives teams a factual base for later review. Raw storage still requires control, so the record must be durable, timestamped, versioned, and traceable, with ownership, access controls, and retention rules. A mature data platform stores raw events in an append-only layer, applies transformations in named stages, and publishes metrics with lineage back to the source event set, so the warehouse, event stream, and dashboard each serve a separate role.
 Click to expand
 | Layer | Purpose | Examples | Failure if omitted |
|---|---|---|---|
| Raw event store | Preserve original operating facts | S3, GCS, Kafka compacted topics, NATS JetStream, ClickHouse raw tables | Teams cannot replay history or inspect excluded records |
| Transformation layer | Apply business definitions | dbt models, Flink jobs, Spark jobs, SQL views | Metric logic becomes buried in dashboards or application paths |
| Metric layer | Publish governed measures | Looker explores, Cube semantic layer, dbt metrics, Power BI datasets | Teams report different values for the same measure |
| Reconciliation layer | Compare raw, transformed, and reported counts | Great Expectations, Monte Carlo, custom count checks | Pipeline loss and definition drift go undetected |
The architecture does not require expensive infrastructure at early scale. A startup with 50,000 daily events can preserve raw JSON payloads in object storage for a small monthly bill, while a company processing 500 million events per day needs partitioning, compaction, retention policy, and cost controls. The principle stays constant across those scales, since you preserve the event before judging its value and apply business logic after the organization has a durable record of what occurred.
This sequence matters because business rules change faster than operating history. A pricing team changes package names, a support team changes severity codes, and a product team changes onboarding milestones, and raw events let the organization recalculate old periods under current rules. The raw layer also creates a shared language across teams, so product can inspect user behavior, finance can inspect revenue events, and engineering can inspect deployment sequence. Each team reads from the same preserved record even when their downstream metrics differ, which reduces executive arbitration. Leaders spend less time deciding which dashboard to trust and more time deciding what action follows from the evidence.
Metric grooming and pipeline loss produce the same executive symptom
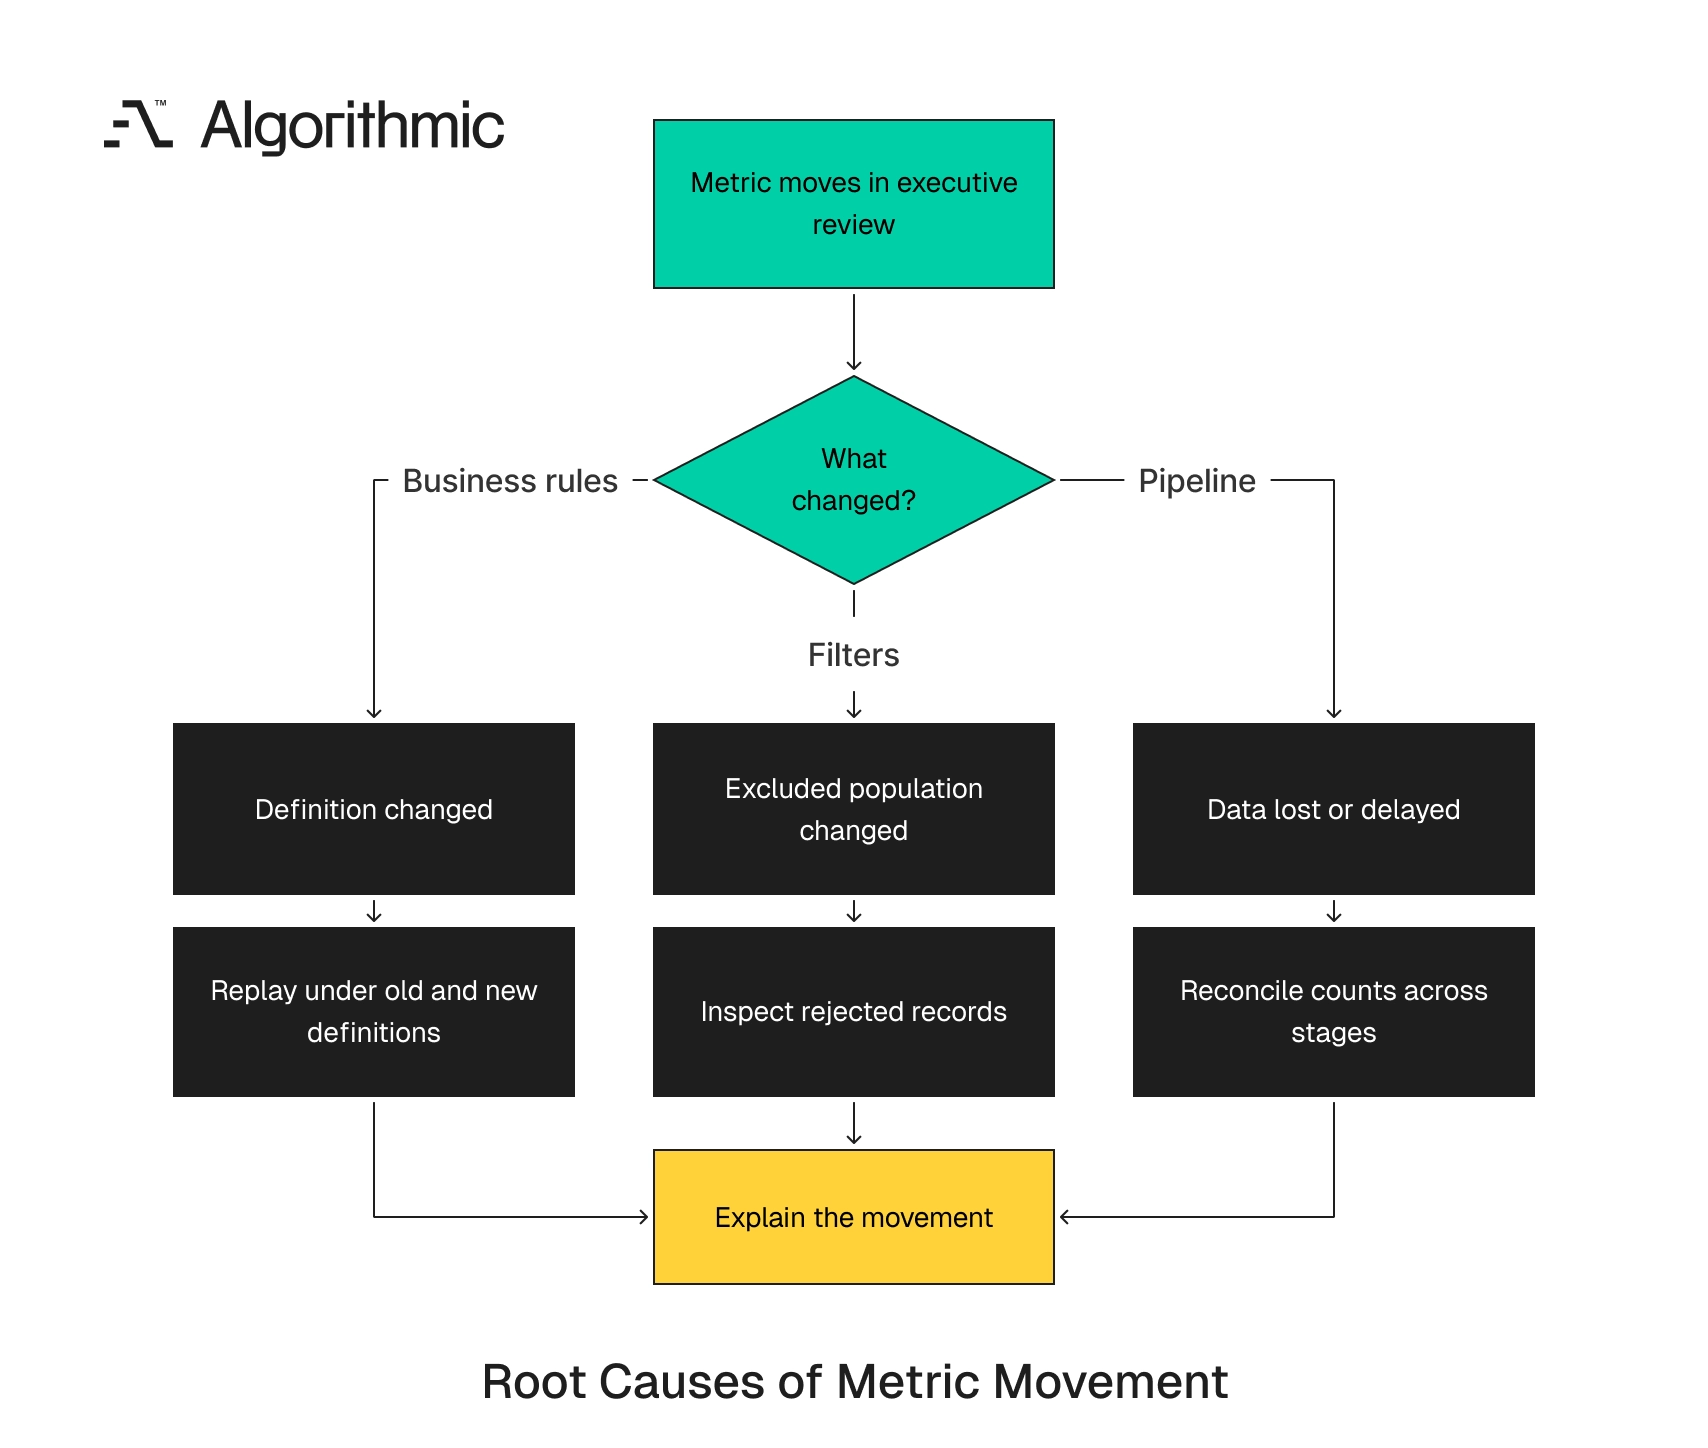
A senior leader sees one number, whether quality improved, conversion declined, revenue rose, or churn fell. The dashboard rarely distinguishes performance change from measurement change, so both appear as movement in the same executive chart. Three mechanisms produce the same visible pattern, since business rules change, filters change, or pipelines lose or delay data.
 Click to expand
 Business rules changed
A product team redefines activation from “created first project” to “invited first collaborator”, a support team changes defect severity classification, or an engineering team stops counting rollback deployments as failures after changing release policy. These changes can be valid, but they need explicit records, version history, and replay support across prior periods, so a metric definition should carry the same engineering discipline as production code. Without raw event preservation, the organization cannot restate old metrics under new definitions, trend lines become mixtures of operating changes and measurement changes, and the executive team debates interpretation because the platform cannot produce evidence.
Take a product organization that reports a 14% activation increase after changing the milestone definition. With raw events, the team can calculate both definitions for the same historical period, but without them the team relies on screenshots, stale extracts, and memory. A strong metric record includes definition owner, approval date, transformation code version, affected dashboards, and a backfill status for prior reporting periods. Finance teams apply this discipline to revenue recognition, and operating metrics deserve the same treatment.
Definition records should include sample input events and expected output rows, along with boundary cases such as deleted users, refunded invoices, reopened defects, and delayed activations. Those examples prevent later teams from changing semantics through small SQL edits. Metric changes also need release notes, because a one-line change in a dbt model can shift a board metric by several percentage points, and the leadership team should see that change before the next operating review.
Filters changed
Analytics teams often remove events to improve report clarity. Common filters include internal employee accounts, QA environments, duplicate device identifiers, demo tenants, suspicious traffic, low-confidence attribution, and failed validation records, and these filters shape the reported business. Each filter should have an owner, a definition, a deployment date, and a count of excluded records, plus a reason and a review cycle. A filter created during a one-week incident should not remain in a board metric for the next four quarters.
Filtering carries operating risk when it happens before preservation, since each added filter changes what the organization can later prove. A mature platform treats excluded records as data, storing the original event, the filter rule, the rule version, and the exclusion reason, which lets teams examine the excluded population during incidents instead of rebuilding it from application logs. Take bot filtering, where a marketing team excludes traffic from known data centers to improve funnel readability. If those events are preserved, security and growth teams can later inspect fraud patterns, campaign abuse, and false positives.
Filters also need volume monitoring. If an employee-account filter removes 2% of traffic for nine months and then removes 11%, the change deserves review, because the filter may be correct or it may hide a customer segment, instrumentation change, or identity-resolution failure. The filter record should include the excluded count by day and source, along with sample event identifiers for audit sampling, since leaders cannot manage what the analytics platform permanently deletes before review.
Pipelines lost or delayed data
Pipeline loss is harder to see because dashboards often report on received data. If Segment, RudderStack, Kafka Connect, Airbyte, Fivetran, or a custom ETL job drops records, the dashboard can still render normally, and the absence of a record rarely announces itself in the chart. A small ingestion loss can change executive reporting more than a product release, and it can create a false improvement when low-quality events disappear from the reported population. Leaders need a way to separate platform behavior from business behavior.
Teams need count reconciliation at every boundary, from producer count, broker count, and raw store count through transformed count, metric count, and dashboard count. Each stage should expose event volume, processing lag, rejection count, and schema validation failures, and those counts should be retained alongside the metric and reviewed during disputes. Take a mobile release that increases payload size and causes a collector to reject events above a limit. The activation dashboard then shows fewer failed onboarding events, and a raw quarantine stream reveals the rejected payloads before the team misreads the chart.
A strong pipeline record also includes replay offsets, batch IDs, source file manifests, and checkpoint timestamps, which let engineers isolate loss to a producer, broker, transformation job, or dashboard refresh. The goal is to find the failed boundary in minutes instead of after weeks of Slack analysis. Pipeline delay deserves the same treatment as pipeline loss, since a dashboard refreshed at 9:00 a.m. can miss late-arriving events from an overnight batch. If those late events cluster in a region or payment provider, the metric can point leaders to the wrong decision. A practical control is a daily count ledger that records expected count, received count, accepted count, rejected count, and late-arrival count for each source, which gives executives more evidence than another visual summary.
Causal analysis requires more than outcomes
Operational leaders often ask causal questions. Did the new onboarding flow increase activation, did the incident review process reduce repeat failures, did feature flag rollout reduce support volume, or did the new deployment gate reduce production defects? Each question requires a record of exposure, timing, prior state, and outcome, and outcome dashboards alone cannot answer them. A post-change metric shows what happened after a date, but it does not show who received the intervention, what they looked like before treatment, or which concurrent changes affected the same population.
Causal analysis needs action assignments, pre-treatment covariates, and outcome timelines. The platform must record who received which intervention, what was true before it, and what happened after, and that record belongs in the operational event model. For product analytics, that means preserving assignment events for A/B tests, feature flags, pricing experiments, onboarding variants, and notification campaigns. For engineering operations, it means preserving deployment events, code ownership, review depth, incident severity, on-call load, test status, and customer impact windows. For revenue operations, it means preserving routing rules, discount approvals, renewal dates, territory changes, and handoff events.
A dashboard that reports activation rate after an onboarding change lacks the evidence required for causal review. Teams need the assignment event, the user’s prior state, and enough outcome history to see delayed effects. This is a data engineering requirement that belongs in schema design, event contracts, service targets, and automated tests, and if the event model omits assignment, the organization cannot recover it from a monthly conversion chart. A clean p-value cannot repair a measurement system that never captured the assignment.
A feature flag example makes the requirement concrete. The platform should store user ID, account ID, flag key, variant, assignment time, flag evaluation reason, and prior product state, because without that record a later lift calculation mixes exposed users, ineligible users, and users assigned after they converted. Engineering operations has the same need, since a deployment gate can appear to reduce production defects after rollout, and the team needs deployment size, code owner, test results, service criticality, reviewer count, and incident windows to evaluate the change. Revenue operations needs comparable records, so if a sales-routing rule changes, leaders need account attributes before routing, assigned owner, reassignment time, discount path, and close outcome, none of which a quarterly bookings dashboard can recover.
Causal review also requires a stable identity model. A user, account, contract, invoice, deployment, or incident can change identifiers across systems, so the event model needs durable keys and mapping records with timestamps for each identity change.
Event replay separates confidence from reconstruction theater
When definitions change, leaders should expect the analytics team to replay history. A replay takes raw events from a defined time range, applies a specific transformation version, and produces a restated metric, and the output should include source range, code version, parameters, row counts, and rejection counts. This ability matters in four recurring scenarios. Finance restates revenue recognition after a product packaging change, product changes activation criteria after finding the previous milestone did not reflect customer value, engineering changes defect taxonomy after separating escaped defects from internally discovered defects, and operations changes service-level measurement after excluding customer-paused workflow time. Each scenario affects reported performance and leadership decisions.
Historical recomputation works when source events remain available and transformation logic can run again, a principle streaming databases and event platforms increasingly treat as a first-class engineering problem. Event replay also protects leaders from false certainty, so if a metric moves by 9% after a release, the team can rerun it with the prior definition, the new definition, and the raw event count, which separates product impact from measurement movement.
Replay should be tested before the company needs it. A quarterly replay exercise on one executive metric is enough to expose missing fields, unstable joins, undocumented filters, and broken retention, and the first replay should not happen during a board meeting. That exercise should have a written acceptance test, where the team restates a metric for a closed reporting period and compares the output with the published value. Any difference needs a named cause, whether code change, late data, filter change, source correction, or pipeline loss. The best exercises also include a failure drill that removes one expected field from a sample input, changes one filter version, and delays one batch, so the team detects each condition through reconciliation instead of manual inspection.
Replay also needs cost boundaries, since recomputing two years of high-volume clickstream data can create large warehouse bills if the team scans unpartitioned tables. Good replay design uses partitions, manifests, checkpoints, and sample windows before full backfill. The replay output should be stored as an artifact with run ID, source locations, transformation version, operator, start time, end time, and validation result, because that artifact becomes evidence during audit, board review, and incident closure.
Architecture patterns that preserve operational truth
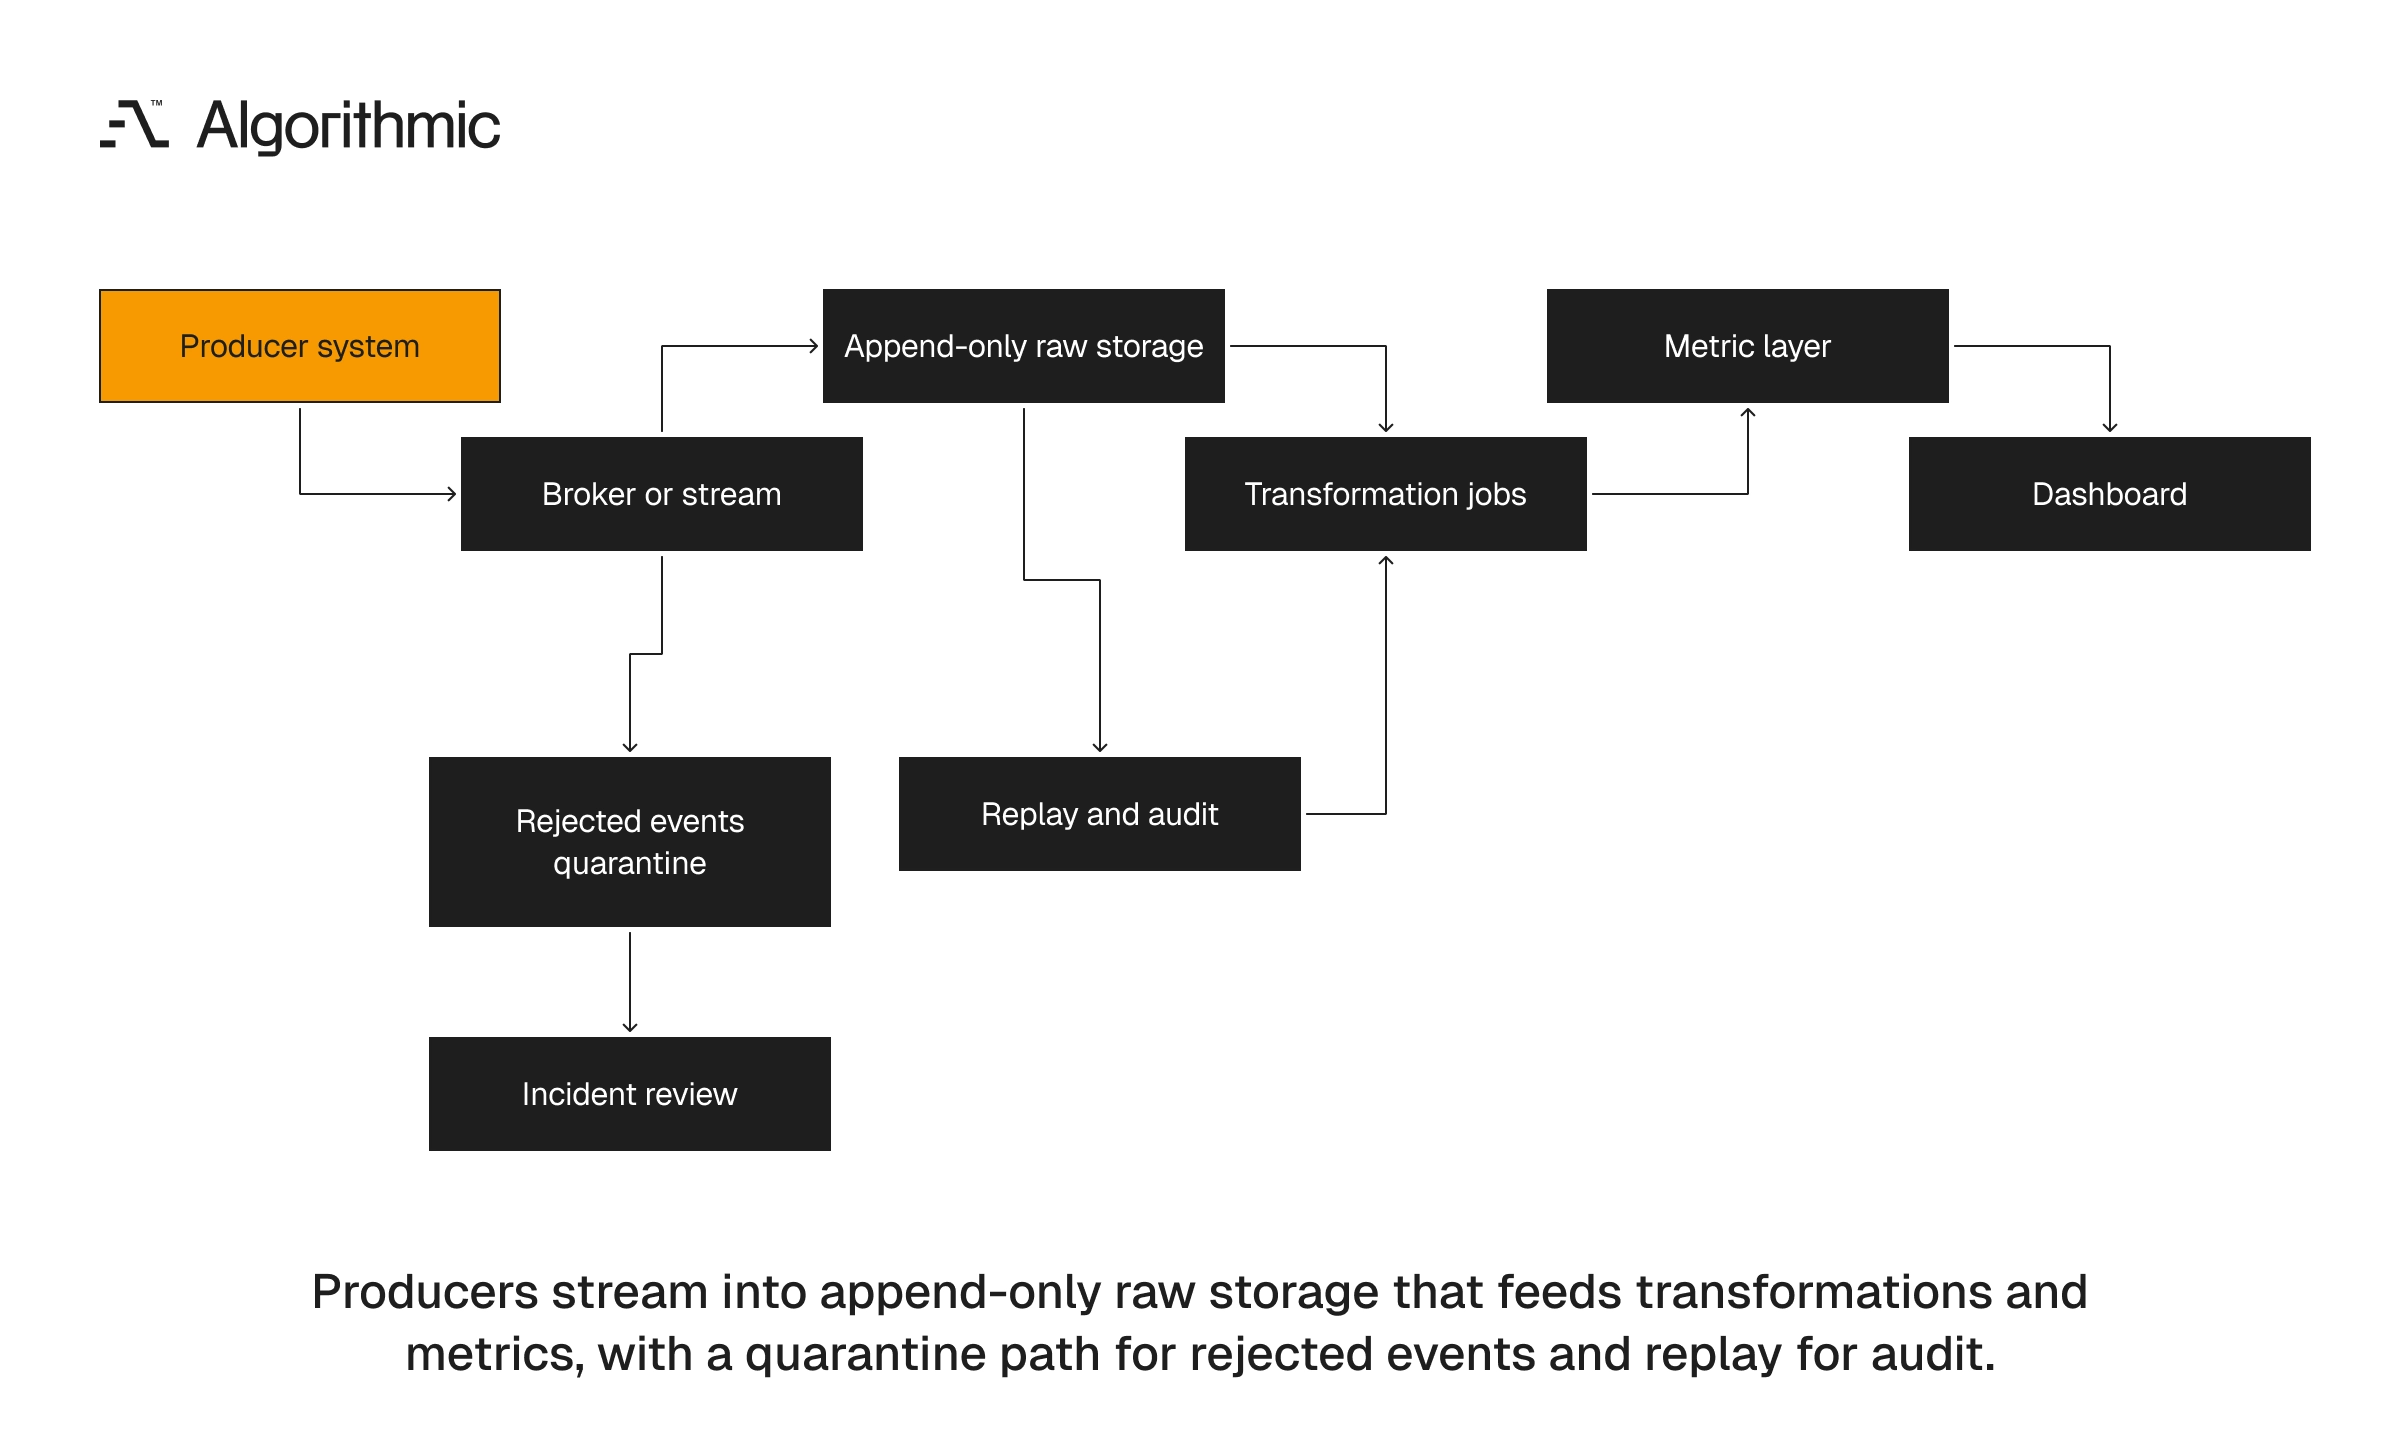
Raw event preservation requires explicit choices, and it does not emerge from adding dashboards to operational systems. The architecture must treat events as durable records before they become metrics. A sound design has four parts, since it lands operational events in append-only storage, records event contracts and schema versions, stores rejected and malformed events, and mirrors events across boundaries when the organization needs auditability across regions, business units, or edge systems. These patterns apply to product, engineering, revenue, support, and finance operations.
 Click to expand
 The design should also define ownership. Each event type needs one producing team, one consuming data owner, and one escalation path, because shared ownership without named accountability delays fixes during incidents.
Use append-only storage for operational events
Operational events should land in an append-only store before transformation. Common patterns include Kafka topics with log compaction, NATS JetStream streams, Amazon S3 or Google Cloud Storage partitions, Snowflake external tables, BigQuery raw datasets, and ClickHouse MergeTree tables, and the specific technology matters less than the preservation contract. For regulated domains, the raw layer should include immutability controls and access logging, and for high-volume systems, retention tiers can separate 30-day hot storage from 13-month cold storage. Access patterns should determine file formats, partitions, and compaction schedules.
The key design point is sequence preservation, since a payment, deployment, or incident is a sequence of decisions and state transitions, and reliability depends on preserving the chain of events instead of storing the final record alone. Sequence matters in executive reporting as well, because a payment that failed, retried, succeeded, reversed, and settled carries a different business meaning from a payment marked “complete”, and the final status hides the operating path.
Append-only design also reduces audit ambiguity. An updated row can erase the prior state unless the system stores change history separately, while an event log records the order of decisions and lets teams reconstruct the metric as of a specific reporting date. Append-only storage also supports forensic review, so if an incident started at 14:07 UTC, the team can inspect events before and after that minute, and the sequence shows whether the failure followed a deploy, a configuration change, a payment-provider response, or a traffic spike. The raw store should reject silent overwrites, and corrections should arrive as new events with references to the original event, which preserves both the original operating fact and the later correction.
Record event contracts and schema versions
Every event type needs a contract. The contract should define required fields, allowed values, timestamp semantics, identity fields, producer service, owner, and version, and it should state which fields can contain sensitive data. A deployment event should include deployment ID, service name, commit SHA, environment, actor, start time, completion time, status, rollback reference, feature flag state, and change category. A bug report event should include reporter source, severity, component, customer impact, reproduction status, first-seen timestamp, and classification version. A revenue event should include customer ID, contract ID, invoice ID, currency, booking date, effective date, recognition rule, and source system.
Schema evolution needs forward and backward compatibility rules, so a new field should not silently alter historical interpretation, and a removed field should have a migration plan and a documented replacement. Event contracts should live in version control with owners and review history, and Protobuf, Avro, JSON Schema, and OpenAPI all work when teams enforce compatibility checks. The tool matters less than the discipline around change, and contracts also need automated gates, so a producer should fail a build when it removes a required field or changes timestamp semantics, and a consumer should expose validation failures before a dashboard publishes a partial metric.
Timestamp semantics deserve particular attention. Event time, ingestion time, processing time, and dashboard refresh time answer different questions, and confusing those fields creates disputes about whether an event happened, arrived, processed, or appeared in a report. Identity semantics also need explicit rules, so user ID, account ID, workspace ID, contract ID, and device ID should have documented relationships, and when identity merges occur, the merge event should become part of the preserved history.
Store rejected and malformed events
Rejected events are often the strongest evidence during an incident. A spike in malformed activation events after a mobile release can explain a conversion drop, and a payment failure parser that rejects new gateway codes can hide the operating incident from the dashboard. Store rejected events in a quarantine table or dead-letter stream, and record rejection reason, validator version, producer service, ingestion time, and original payload, retained long enough to support incident review and quarterly reporting audits.
Many analytics systems fail at this point, since they count only what they can parse, then report the parsed subset as business reality, and the rejected records disappear from the operating conversation. A good rejection model separates data quality from business truth, because the event can be invalid for a metric and still useful for an incident investigation, and a malformed payload can expose a release defect, an SDK version problem, or a regional ingestion outage. The quarantine record should carry severity, since a malformed marketing attribution field has a different operating impact from a missing payment status, and severity helps the team route alerts to growth, finance, product, or platform owners.
Quarantine data needs privacy controls. A malformed payload can contain unexpected personal data because validation failed before classification, so access should be restricted, logged, and tied to incident or audit workflows. Teams should also track reprocessing status, because a rejected event can later become valid after a parser update or source correction, and the platform should record whether the event was reprocessed, ignored, or permanently excluded.
Mirror events across boundaries when needed
Distributed organizations often collect events at edge locations, business units, or regional systems. The central analytics platform needs a faithful copy, not a derived sample, because a sample cannot support audit, replay, or dispute resolution. Mirroring preserves sequence numbers and timestamps, and those fields are essential for reconciliation and replay. Merging can be appropriate for consolidated metrics, but mirroring is stronger for auditability, since a merged count can show volume while a mirrored stream can show order, loss, delay, and duplication.
The distinction matters in field service, payments, logistics, and healthcare operations, where regional systems often experience partial connectivity and delayed synchronization. A central dashboard that receives only summaries cannot reconstruct what happened during the outage window. Take a field operations team that completes work orders offline during a four-hour network outage, where a summary upload can report 137 completed jobs. A mirrored event stream can show assignment, arrival, completion, exception, supervisor approval, and sync timing for each job.
Mirroring also helps when business units operate separate systems. A company formed through acquisitions may have three billing platforms and two support tools, and preserved event streams give central finance and operations teams a path to reconcile results without forcing an immediate system migration. Boundary records should include source system, region, sequence number, producer timestamp, receipt timestamp, and transfer status, which show whether a central metric reflects operational reality or synchronization timing and which system owns correction work.
A practical preservation checklist for VPs of engineering
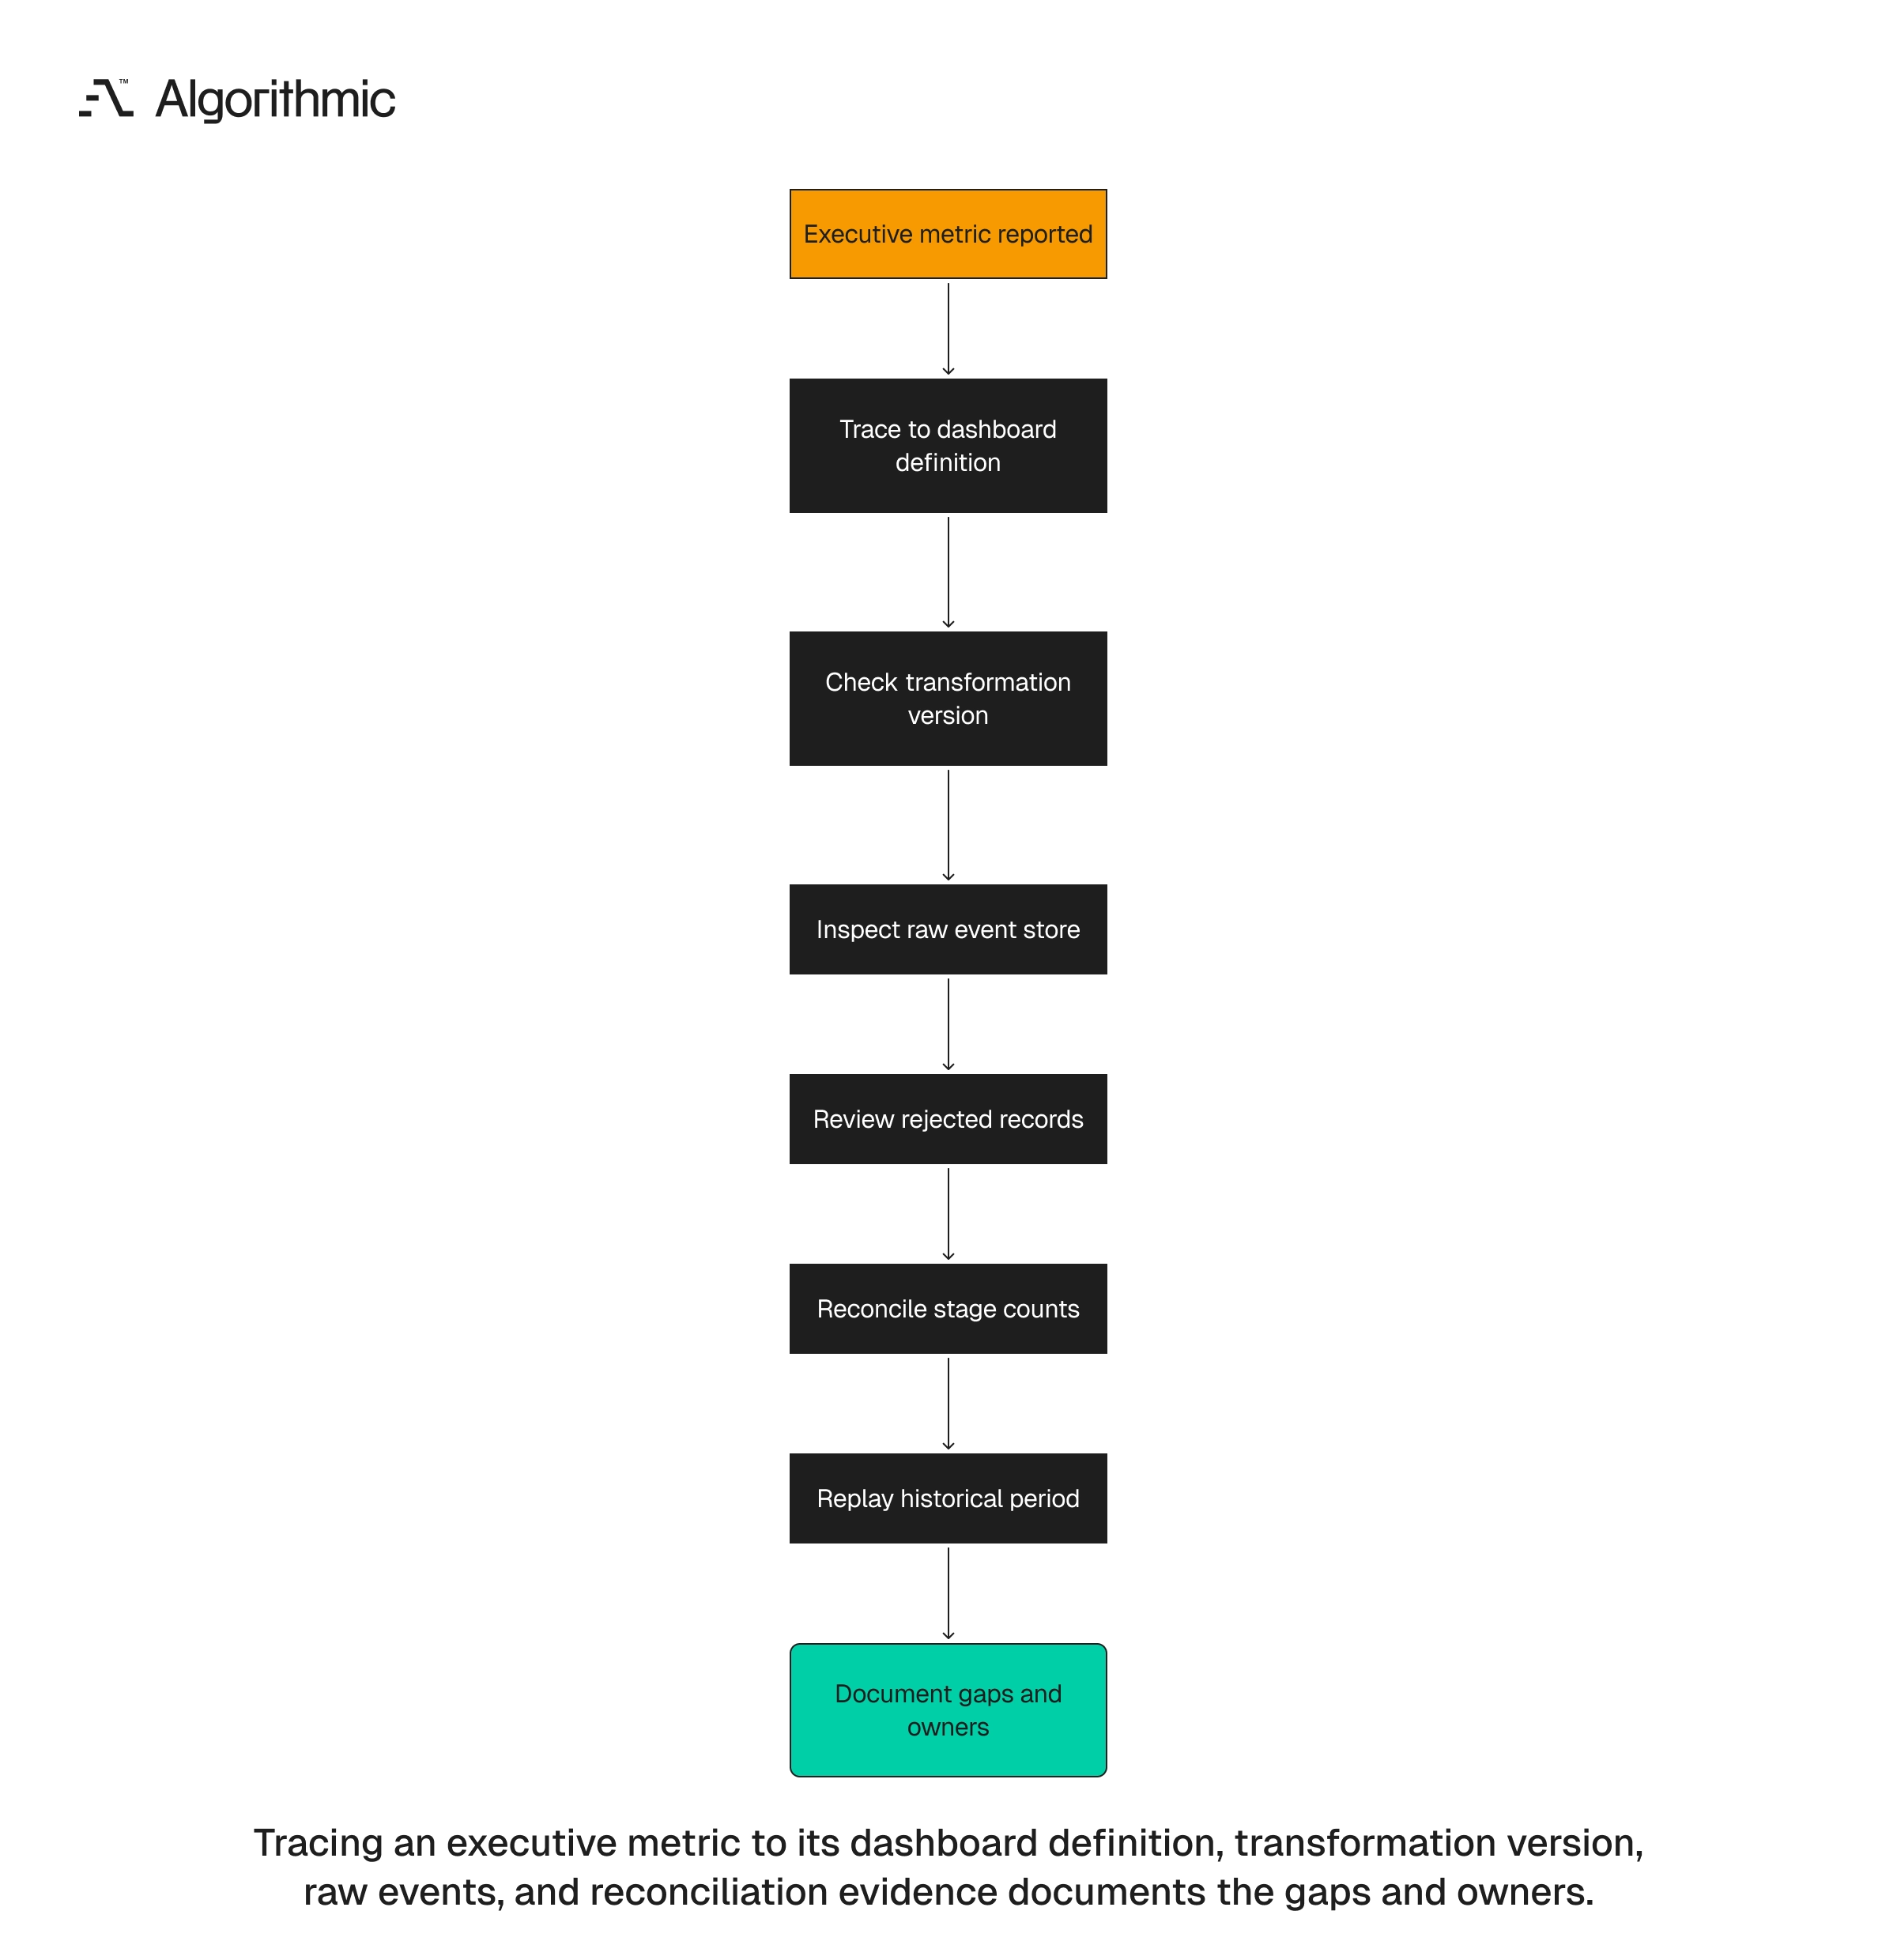
A VP of Engineering or operations leader can assess an operational analytics platform in one working session. The goal is to test whether the platform supports incident response and executive reporting under pressure, and the exercise should use actual metrics from the weekly leadership review. Use the following checklist, assign each item a pass, fail, or unknown, and treat unknown as fail until the team produces evidence.
 Click to expand
 Raw event storage
- Every operational event lands in durable storage before transformation.
- Raw events include original payload, producer service, ingestion timestamp, event timestamp, schema version, and identity fields.
- Retention is explicit, with 30 days hot, 12 to 24 months cold, or another documented policy.
- Access controls protect sensitive fields while retaining the event record.
- Deletion and privacy rules are documented for GDPR, HIPAA, SOC 2, or sector-specific needs.
A pass requires proof, not verbal assurance. Select one executive metric and trace the reported value to source events, and if the team cannot show the raw layer, the metric has weak audit support. The evidence should include an object path, table name, topic name, or storage manifest, along with a sample payload and retention policy, and a screenshot of a dashboard does not satisfy this check. The review should sample at least one accepted event and one rejected event and verify that both records share traceable identifiers, because without those identifiers reconciliation becomes manual work during the next incident.
Transformation transparency
- Metric definitions live in version-controlled SQL, dbt models, Flink jobs, or application code.
- Each dashboard metric maps to a named transformation version.
- Filters have owners, rationales, and excluded-record counts.
- Rejected events are stored with rejection reasons.
- Teams can run the same metric under two definitions for the same historical period.
The strongest signal is repeatability, since a different analyst should produce the same number from the same source range and transformation version, and if that fails, the metric depends on tribal knowledge. A second signal is ownership, because every metric in the executive review should have one accountable business owner and one technical owner, and shared ownership without named accountability creates unresolved disputes during incidents. Transformation logic should also carry test cases, so a defect metric should include reopened tickets, duplicate tickets, severity changes, and customer-impact flags, and a revenue metric should include credits, partial refunds, multi-currency invoices, and delayed recognition. Business owners should review metric definitions on a fixed schedule, where quarterly review is enough for stable metrics and metrics tied to pricing, packaging, or release process changes need review before the change reaches production.
Reconciliation and replay
- Producer, broker, raw store, transformation, and dashboard counts are reconciled daily.
- Reconciliation failures create alerts with an owner and severity.
- Backfills are tested on a sample window before full historical recomputation.
- Metric replay produces a record of source range, code version, parameters, and output count.
- Incident response runbooks include analytics pipeline checks, not only application checks.
A platform that fails more than 3 of these 15 checks will struggle during an executive reporting dispute or production incident. The failures also reveal where to invest first, and raw storage and reconciliation usually produce the fastest reduction in investigation time. The checklist should become part of quarterly operating review, so pick one metric each quarter, replay a prior period, and document every difference, which creates a record of data quality, metric stability, and platform maturity. The review should end with named remediation work, such as adding dead-letter retention for payment events, versioning activation filters, or adding producer counts to deployment events. Each item should have an owner, target date, and acceptance test, and a mature review also records what the team deliberately accepts, since some low-risk events may have short retention for privacy or cost reasons and that decision should be explicit and visible to the leaders who use the metric.
The cost profile is measurable
Raw event preservation has storage and engineering cost, while the alternative has investigation cost, reporting risk, and slower incident response. Those costs appear in executive time, finance rework, support escalations, and delayed product decisions. For a mid-market SaaS company with 2 million daily product events, raw JSON compressed in object storage consumes a modest daily footprint depending on payload size, and at common cloud storage prices, cold retention for one year often costs less than one senior engineer-week per quarter. Compression with Parquet or Zstandard can reduce the bill further for many event types.
The larger cost is engineering discipline, since teams need event contracts, schema validation, replay jobs, transformation versioning, and count reconciliation. A four-person data engineering team can set up the foundation in a few months when source systems are accessible and event ownership is clear. The first phase should be narrow, so start with the 10 metrics used in weekly executive reporting, instrument the source events, preserve the rejected population, and reconcile counts from producer to dashboard.
Spending on operational analytics keeps climbing, but more tooling will not improve decision quality if the platform discards original operating facts. Kurrent reported a benchmark across 300 questions where full event streams scored 85%, current state with change data capture scored 59%, and current state alone scored 28%. The lesson for operational analytics is direct, since retained event history gives systems more evidence for accurate answers, and the same pattern appears in executive reporting when teams can inspect the sequence behind the summary.
The investment case improves when leaders include investigation time. A single three-week metric dispute can consume a VP, two engineering managers, three analysts, and several product leads, and the labor cost often exceeds a year of raw storage for a mid-market event volume. The risk case is stronger in regulated or audited environments, where revenue recognition, customer-impact reporting, incident reporting, and service-level credits all require evidence, and a derived dashboard cannot replace the source record during audit or dispute resolution.
Cost control should be part of the design from the start. Teams should define hot, warm, and cold retention tiers for each event class, and payment, deployment, incident, and revenue events usually deserve longer retention than anonymous product telemetry. Storage format also affects cost, since raw JSON works for initial capture and forensic review while Parquet with Zstandard compression reduces scan cost when teams replay large windows or run repeated reconciliations. Engineering teams should measure the cost of uncertainty by tracking hours spent resolving metric disputes, incidents delayed by missing data, and analyst time spent rebuilding history, because those numbers turn raw event preservation from a platform preference into an operating investment.
Governance gives the data model authority
Raw event preservation needs governance to become trusted. Governance means named owners, versioned definitions, access controls, and operating routines, and it does not require a large committee or a slow approval process. Each executive metric should have a one-page record that names the business owner, technical owner, source events, transformation version, filters, rejected-event handling, and reconciliation checks, and it should show the last replay date and any known limitations. This record should live near the metric code, not in a slide deck, so dbt documentation, a data catalog, a Git repository, or a warehouse metadata table can all work, and the record must be easy to inspect during an incident.
Access policy should reflect the sensitivity of raw events. Product telemetry may include user identifiers, support events may include customer text, and payment events may include regulated financial fields, so masking, tokenization, field-level access, and audit logs belong in the raw-layer design. Retention policy should reflect both operating value and legal requirements, since GDPR deletion, HIPAA controls, SOC 2 audit evidence, and contractual data processing limits can all affect raw storage, and teams should define these rules before preserving sensitive payloads at scale. Governance also protects against metric sprawl, because a company can end up with five activation rates, three churn definitions, and two incident-severity taxonomies, and governed definitions turn preserved events into trusted measures. The same discipline underpins data lineage from ingestion to audit evidence, where provenance captured at the source builds the audit trail instead of forcing a costly retrofit.
Dashboards are outputs and evidence lives in events
Executive dashboards have a place, since they compress operating complexity into a form leaders can use, and they also hide lineage by design. A dashboard is the last mile of an analytics system, so it should never be the first place where truth exists. Truth should live in preserved events, governed transformations, and repeatable reconciliation. Strong operational analytics starts with preserved events, then adds transformations, tests, metrics, dashboards, and alerts, and that order lets leaders ask why a number moved, who changed the definition, which records were excluded, where data was lost, and how the metric reads under a prior rule set. It also gives engineering, finance, product, and operations teams a shared record during disputes.
For VPs of Engineering and operations leaders, the next step is direct. Audit the 10 metrics used in weekly executive reporting, and for each metric trace one reported number back to raw events, filter logic, rejected records, transformation code, and reconciliation checks, then preserve the raw event layer before adding another dashboard. The audit should end with named gaps and funded remediation, so assign one owner for raw storage, one for metric definitions, and one for reconciliation, and review progress in the same forum that reviews revenue, quality, delivery, and customer metrics.
The standard is evidence under pressure. During a board review, finance close, customer escalation, or production incident, the team should trace the metric to the event record in minutes, and that ability comes from preservation decisions made long before the metric moved. Algorithmic builds data infrastructure and integration work that preserves raw events, versions transformations, and reconciles counts from source to dashboard. Start a conversation if your team is losing weeks to metric disputes the platform cannot settle.