

A SaaS company with eleven revenue, product, finance, and customer success teams can agree on one star schema and still produce seven answers for monthly recurring revenue. The schema rarely fails first. The fact_booking table has a declared grain, the dim_customer table has a surrogate key, slowly changing dimensions carry Type 2 history, dbt tests pass, and Looker dashboards load in seconds.
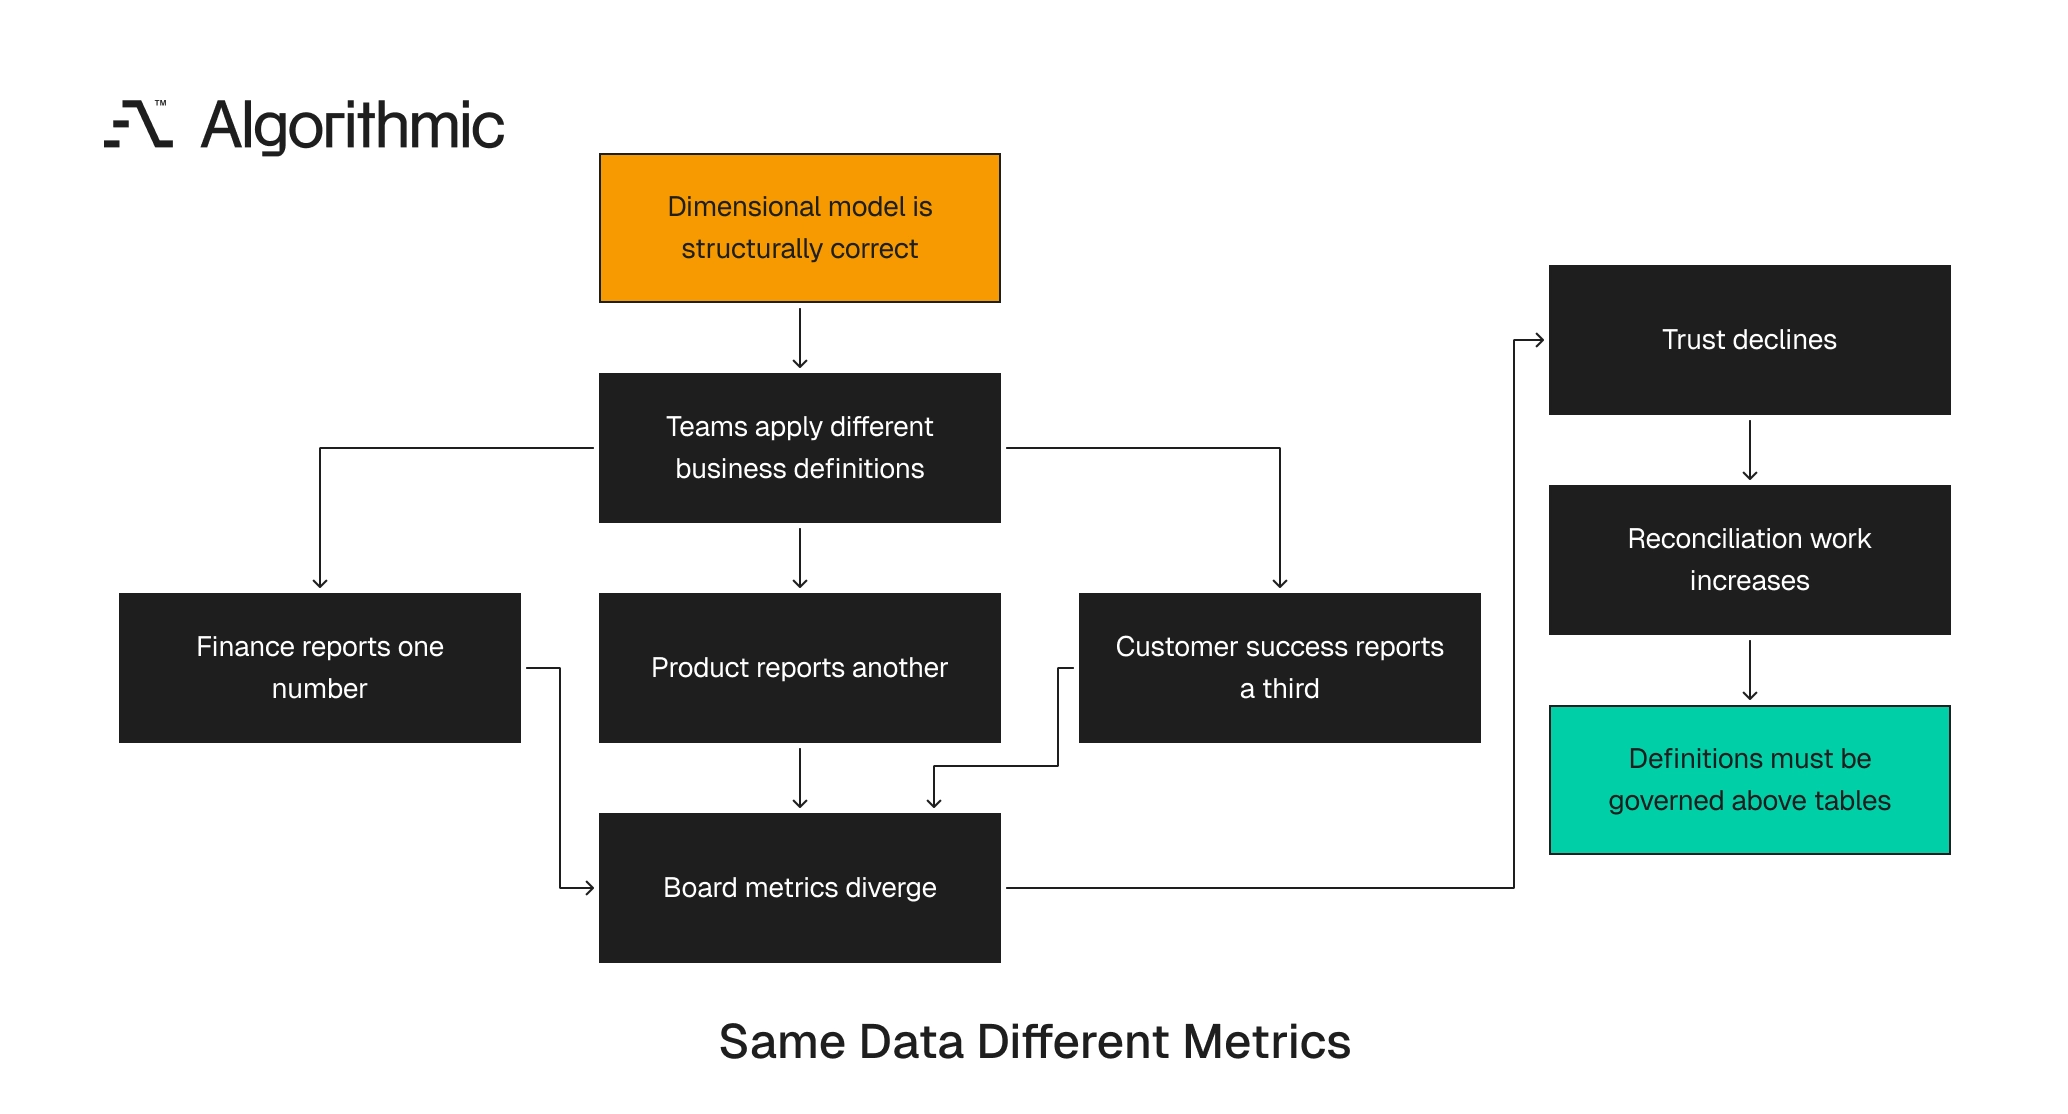
The failure sits one level above the tables. Product defines activation as first project created and customer success defines it as first invited teammate. Finance excludes trial accounts while growth includes them for cohort analysis. The warehouse becomes a negotiation venue instead of a system of record.
Dimensional modeling remains one of the strongest methods for analytics system design. It forces grain, history, and query paths into explicit structures, gives analysts predictable joins, and gives business users stable dashboard performance. The problem starts when business definitions move privately across functions, so the data model presents agreement that the business never approved. That gap creates inconsistent board metrics, repeated reconciliation work, and lost trust. This is the meaning layer that good data analytics and business intelligence work has to govern before self-service reporting spreads.
The pattern is common in SaaS companies after the first analytics build. The engineering team completes the warehouse, reporting expands across finance, RevOps, product, and customer success, and the disagreement shifts from table shape to metric meaning. A dimensional model can make data accessible before the company has made its rules explicit, which creates a durable failure mode where every team receives a clean structure and then applies a different commercial interpretation. The issue surfaces during operating meetings, when one executive asks for retention, revenue, or customer count and three teams answer from the same warehouse and defend three different numbers.
Table structure cannot compensate for semantic divergence
A dimensional model answers three structural questions well, recording what event happened, at what grain, and with which descriptive attributes. A semantic model answers different questions. It defines which events qualify, which entities count, which dates govern attribution, and which exclusions apply, and those decisions define “customer”, “booking”, “retention”, “activation”, and “revenue”.
A fact table can be structurally correct while the measure remains commercially unstable. gross_revenue_amount can hold a valid decimal value for every transaction while finance, sales, and product analytics apply different metric rules. The disagreement usually appears in exclusions, where teams debate tax, credits, refunds, reseller margin, multi-year prepayments, and usage overages, and each choice changes the number in executive reporting.
Kimball-style dimensional modeling gives teams a durable physical design, and the guidance on fact tables, dimension tables, grain, and slowly changing dimensions remains sound. The model needs governed definitions above the physical structure before self-service analytics expands, since grain controls row-level meaning while business policy controls metric meaning. Without that control layer, every BI tool becomes a private calculation engine, and Looker, Tableau, Power BI, and notebooks all reproduce the same dispute as it moves from SQL files into calculated fields and spreadsheet extracts.
This issue is architectural because it affects every consumer of the warehouse. A correct join path does not settle which contracts count as retained, and a well-indexed aggregate does not decide which refunds reduce net revenue.
 Click to expand
 Teams often discover the issue after the warehouse is already trusted. A dashboard looks stable for months, then a board review exposes two competing definitions, and the remediation requires code changes, owner decisions, and communication across every reporting consumer. The failure has a predictable technical signature, since models pass schema tests, freshness tests, and referential integrity tests while the business still disputes the answer because those tests do not validate policy.
A dbt test can verify that customer_id is unique in dim_customer, but it cannot decide whether six workspaces under one enterprise agreement count as one customer or six, and that decision belongs to RevOps, finance, product, and the executive team. A BI model can expose a clean measure called arr, yet it cannot decide whether marketplace fees reduce reported ARR, so that rule requires a finance owner and a versioned definition.
This distinction matters during rebuilds. Teams often spend the first four weeks on source ingestion, table design, and naming conventions, then leave metric definitions to the dashboard phase where policy becomes harder to change. The better sequence treats definitions as architecture, so a warehouse design should include entity identity, metric policy, attribution rules, and ownership before dashboards reach business users. That work prevents the first wave of private formulas.
The five boundaries where definitions diverge first
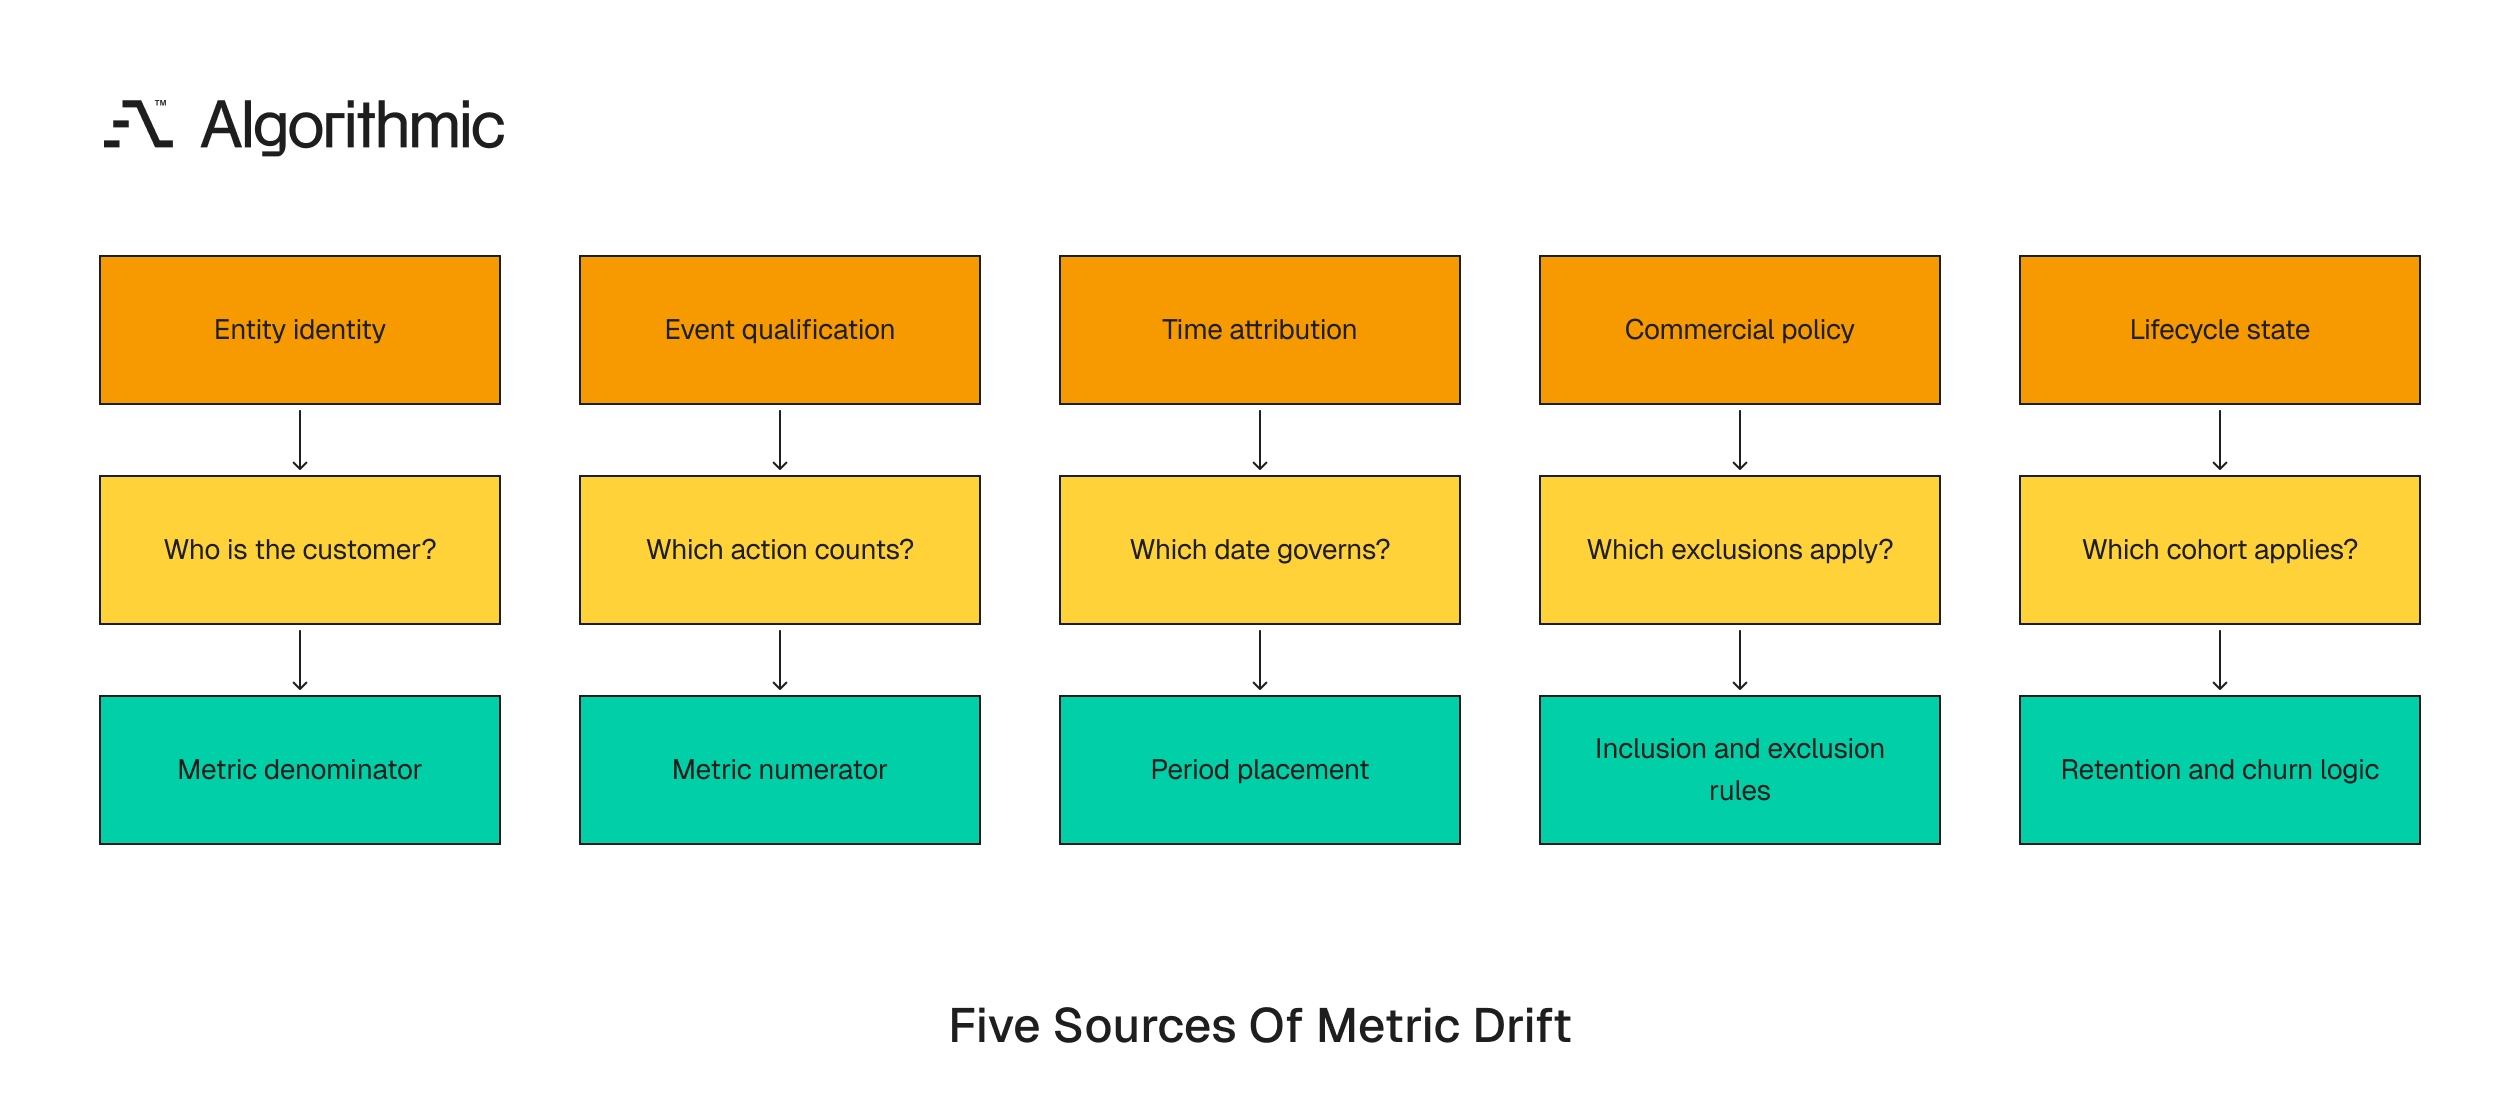
Semantic drift starts at predictable boundaries. Analytics engineers and BI leaders should treat these boundaries as design risks during warehouse rebuilds and resolve them before broad reporting access begins. The five boundaries below cover most executive metric disputes in SaaS warehouses, and each has a structural component and a business-policy component that both must be explicit before the model can support governed reporting.
These boundaries create different failure patterns. Entity identity changes denominators, event qualification changes numerators, time attribution changes period placement, commercial policy changes inclusion and exclusion rules, and lifecycle state changes cohort membership.
 Click to expand
 Entity identity
“Customer” is the first unstable dimension in many B2B warehouses. Sales often treats the customer as the Salesforce account, product analytics uses workspace, tenant, or organization ID, and finance uses the billing entity in Stripe, NetSuite, or Zuora. Support uses the account group created in Zendesk, marketing uses a HubSpot company record, and legal uses the contracting party listed in the master services agreement.
These identifiers do not map one-to-one. A single enterprise customer can have fourteen workspaces, three billing entities, and one parent account, while a startup can create six trial workspaces before one converts. If dim_customer lacks a canonical business entity, downstream metrics split, and customer count, logo retention, expansion revenue, support load, and product adoption all use different denominators. The same account then appears healthy in one dashboard and inactive in another.
The fix starts with an identity decision. The warehouse must define the reporting customer, the billing customer, the product tenant, and the parent account, and each key needs its own purpose, owner, and effective dating. The model also needs relationship tables for many-to-one and many-to-many mappings, since a workspace can roll up to a billing entity and then to a parent account, and those relationships need valid-from and valid-to dates. Mergers and account reorganizations create further pressure, because one customer can acquire another and keep separate product tenants for eighteen months while reporting preserves history and shows the current commercial hierarchy.
Identity rules need explicit examples. An enterprise with fourteen workspaces under one master agreement should count as one logo for retention and fourteen product tenants for adoption analysis. A trial-heavy product creates a second identity problem, because six workspaces tied to the same domain can belong to one future buying committee, and the company needs rules for trial aggregation, domain matching, and duplicate account creation.
Domain matching needs safeguards. The domain acme.com works for a private company with one brand, but gmail.com, outlook.com, and consultant domains create false matches. The warehouse should store match method and match confidence, rank exact billing ID matches above CRM account matches, and require review of fuzzy email-domain matches before use in board metrics.
Manual overrides need an audit trail, so when a RevOps analyst merges two accounts for reporting after a sales territory change, the model should preserve the source records and record who approved the override. Effective dating prevents historical distortion, so if two accounts merge on July 1, June retention should use the June hierarchy and July and later reports should use the new hierarchy.
Event qualification
Activation, onboarding, engagement, and conversion diverge when teams select different qualifying events. A product team can define activation as completing a first workflow, growth can define it as creating an account and inviting another user, and customer success can require a completed implementation checklist. These metrics answer different questions, since the first workflow measures product usage, the invited teammate measures team formation, and the implementation checklist measures service completion. Each measure belongs in the warehouse with a distinct name and owner, because combining them under one activation label creates reporting conflict.
Activation should represent the first delivered promise. Goals should represent repeat behavior, such as second use, fifth use, or weekly active team usage, and the company North Star metric should be a separate customer outcome with measured retention correlation. A project-management product can use projects published within 7 days, an accounts-receivable product can use invoices paid within 14 days, and a security product can use first policy violation remediated within 30 days.
Each event needs a qualifying rule that specifies event name, source system, required properties, exclusion rules, and backfill behavior, because without those details the same metric changes during every instrumentation update. The rule also needs identity requirements, since an anonymous browser event should not count as activation for a paid customer metric and must attach to the approved customer key before publication. Backfills deserve explicit treatment, so if engineering backfills eighteen months of missing events, activation rates can move across prior cohorts and the release note must state whether historical periods changed.
Event qualification also needs negative rules. Internal test workspaces, demo accounts, partner sandboxes, and load-test tenants should carry exclusion flags at the source or in a governed dimension. Product instrumentation changes create another risk, since a front-end team can rename project_created to project_published during a React migration, so the metric should reference an event contract rather than a casual event name. Event contracts should define allowed properties, so invoice_paid should require invoice_id, customer_id, amount, currency, and paid_at, and a row missing customer_id should fail before it affects activation or conversion.
The warehouse also needs bot and automation rules, because a scheduled integration can create 2,000 tasks in a day, so product engagement metrics should define whether integration-generated activity qualifies as human usage. A strong event rule connects measurement to business meaning, so if activation means first realized value, the event should prove that value occurred, and account creation alone rarely proves that outcome in B2B SaaS.
Time attribution
A metric changes when the date field changes. Bookings can use contract signature date, revenue can use service period, retention can use cohort start date, and product activity can use event timestamp in UTC, local tenant time, or reporting-period close date. Each choice changes a trend line near period boundaries, so the warehouse should publish the accepted date for each governed metric. This mirrors the date-alignment failures covered in how date alignment in analytics reduces forecast errors, where the same event counted on different dates drifts the forecast.
A 2026 revenue dashboard can shift by 8 percent when bookings move from contract signed date to effective start date. The SQL can be correct in both versions, and the business meaning changes because the attribution rule changes. Time rules matter most near reporting boundaries, since a deal signed at 23:30 UTC on January 31 can fall into February for an account in California, and a usage event sent eighteen hours late can move across a weekly business review cutoff.
The warehouse should store raw timestamps and reporting dates and publish the accepted attribution date for each governed metric, so analysts do not choose among created_at, signed_at, effective_at, and closed_won_at in dashboard logic. Time attribution also affects compensation and forecasting, since a 240,000 dollar contract signed after the cutover time can move an account executive across a quota threshold, so the date rule must be governed before compensation reporting uses the metric. Late-arriving facts require a published correction policy, because a warehouse can restate the prior month, post adjustments in the current month, or freeze closed periods, and finance should approve the selected policy for revenue and bookings.
Time zone policy needs the same treatment. Product events often arrive in UTC while sales territories operate in local time, so a global SaaS company should define reporting time at the metric level, where revenue uses finance close time and product usage uses tenant-local date, and executive dashboards display that rule. Fiscal calendars add another layer, since a company can close weeks on Sunday, run fiscal months on a 4-4-5 calendar, and report bookings by calendar month, and each calendar belongs in a conformed date dimension. The date dimension should carry fiscal week, fiscal month, fiscal quarter, calendar month, business day flag, and close-period status so analysts join to it instead of rebuilding calendar logic in dashboards.
Backdated contracts require special handling, so when sales operations corrects an effective date after legal review, the governed bookings table should record original date, corrected date, correction reason, and publication date. The same principle applies to product telemetry, since mobile devices can send events days late, so the metric should state whether it uses event occurrence time or ingestion time.
Commercial policy
Revenue definitions diverge when policy lives in dashboards. A finance dashboard can exclude credits, tax, chargebacks, internal accounts, and reseller fees, a product dashboard can include usage-based expansion before invoice finalization, and a board deck can report ARR using annualized committed contract value. These are policy choices, so they belong in governed metric tables or semantic definitions with named owners, and workbook-level calculated fields should not carry accounting policy.
Commercial policy also changes over time, since a company can introduce reseller discounts, multi-entity billing, marketplace fees, or customer credits after outages, and each change adds a new rule to revenue reporting. Metric definitions need version history, so a revenue metric should show which calculation version produced each reported period, and finance should reproduce the number presented to the board six months later. Policy ownership must cover edge cases, since credits issued for service outages differ from credits issued for commercial concessions, and tax collected on behalf of a jurisdiction differs from revenue earned by the company.
Usage-based pricing adds another class of rules. Product telemetry can indicate expansion before billing closes, so finance-approved revenue should follow invoice or ledger rules while product-qualified expansion serves operating analysis. Commercial rules also affect gross margin, since support costs, hosting costs, AI inference costs, and onboarding services can sit in different systems, and finance must define which cost categories belong in customer-level margin. Marketplace sales create common disputes, because AWS Marketplace fees, payment processing fees, and partner margin can reduce net proceeds, and ARR, recognized revenue, and gross margin treat these costs differently.
Multi-year contracts require explicit allocation, since a 600,000 dollar contract over 36 months can create 600,000 dollars in bookings and a different monthly revenue profile, so analysts should never infer the allocation rule from a dashboard chart. Currency policy needs an owner, because a company with EUR invoices and USD reporting must define spot rates, monthly average rates, and remeasurement rules, so the metric table should store both transaction currency and reporting currency. Discounts need classification, since a launch discount differs from a reseller discount, a renewal concession, and a credit memo, and each class affects pricing analysis and revenue reporting differently. The rule set should specify source precedence, so if Stripe and NetSuite disagree, finance-approved ledger data governs reported revenue while operational dashboards use billing data before close with a clear label.
Lifecycle state
Retention and churn depend on state transitions. A customer can be active in product usage, at risk in customer success, delinquent in billing, and open renewal in sales, so one warehouse dimension must define the lifecycle state used for executive reporting while separate attributes preserve operational states owned by each function. State definitions need effective dates, so a Type 2 dim_customer_status table with valid-from and valid-to fields supports historical cohort reporting, and analysts can report March retention using the status known in March.
Lifecycle reporting fails when teams overwrite status fields, since a customer marked churned in June should not appear churned in a January cohort snapshot, and historical reporting needs state as it existed at the reporting date. The model should separate lifecycle state from operational flags, since billing delinquency, CSM risk rating, renewal stage, and product activity each serve different workflows, so executive reporting needs one governed lifecycle state derived from approved rules.
Lifecycle definitions should also describe reversals, because a customer can churn, return within 45 days, and reactivate under the same contract family, so the warehouse needs rules for reinstatement, win-back, and reactivation. This distinction affects retention cohorts, since reinstated customers can inflate retention if the model treats every return as continuous service, and a governed lifecycle table prevents that distortion. State machines help here, so define allowed transitions such as trial to active, active to churned, active to suspended, and churned to reactivated, and reject impossible transitions in tests.
Suspension needs careful treatment, because a customer can stop paying for 30 days, lose access, then pay an overdue invoice, so the company must decide whether that period counts as churn, delinquency, or suspended service. Renewal timing affects the answer, since a contract ending March 31 with renewal signed April 7 creates a gap, so the lifecycle rule should state whether grace periods exist and how long they last. Customer success states should remain separate, since a high-risk customer can still be active and an inactive product tenant can still be commercially retained under a paid contract. This separation keeps operating teams honest, so product can report declining usage without changing finance retention and customer success can report risk without changing commercial state.
The cost compounds after dashboards depend on unstable definitions
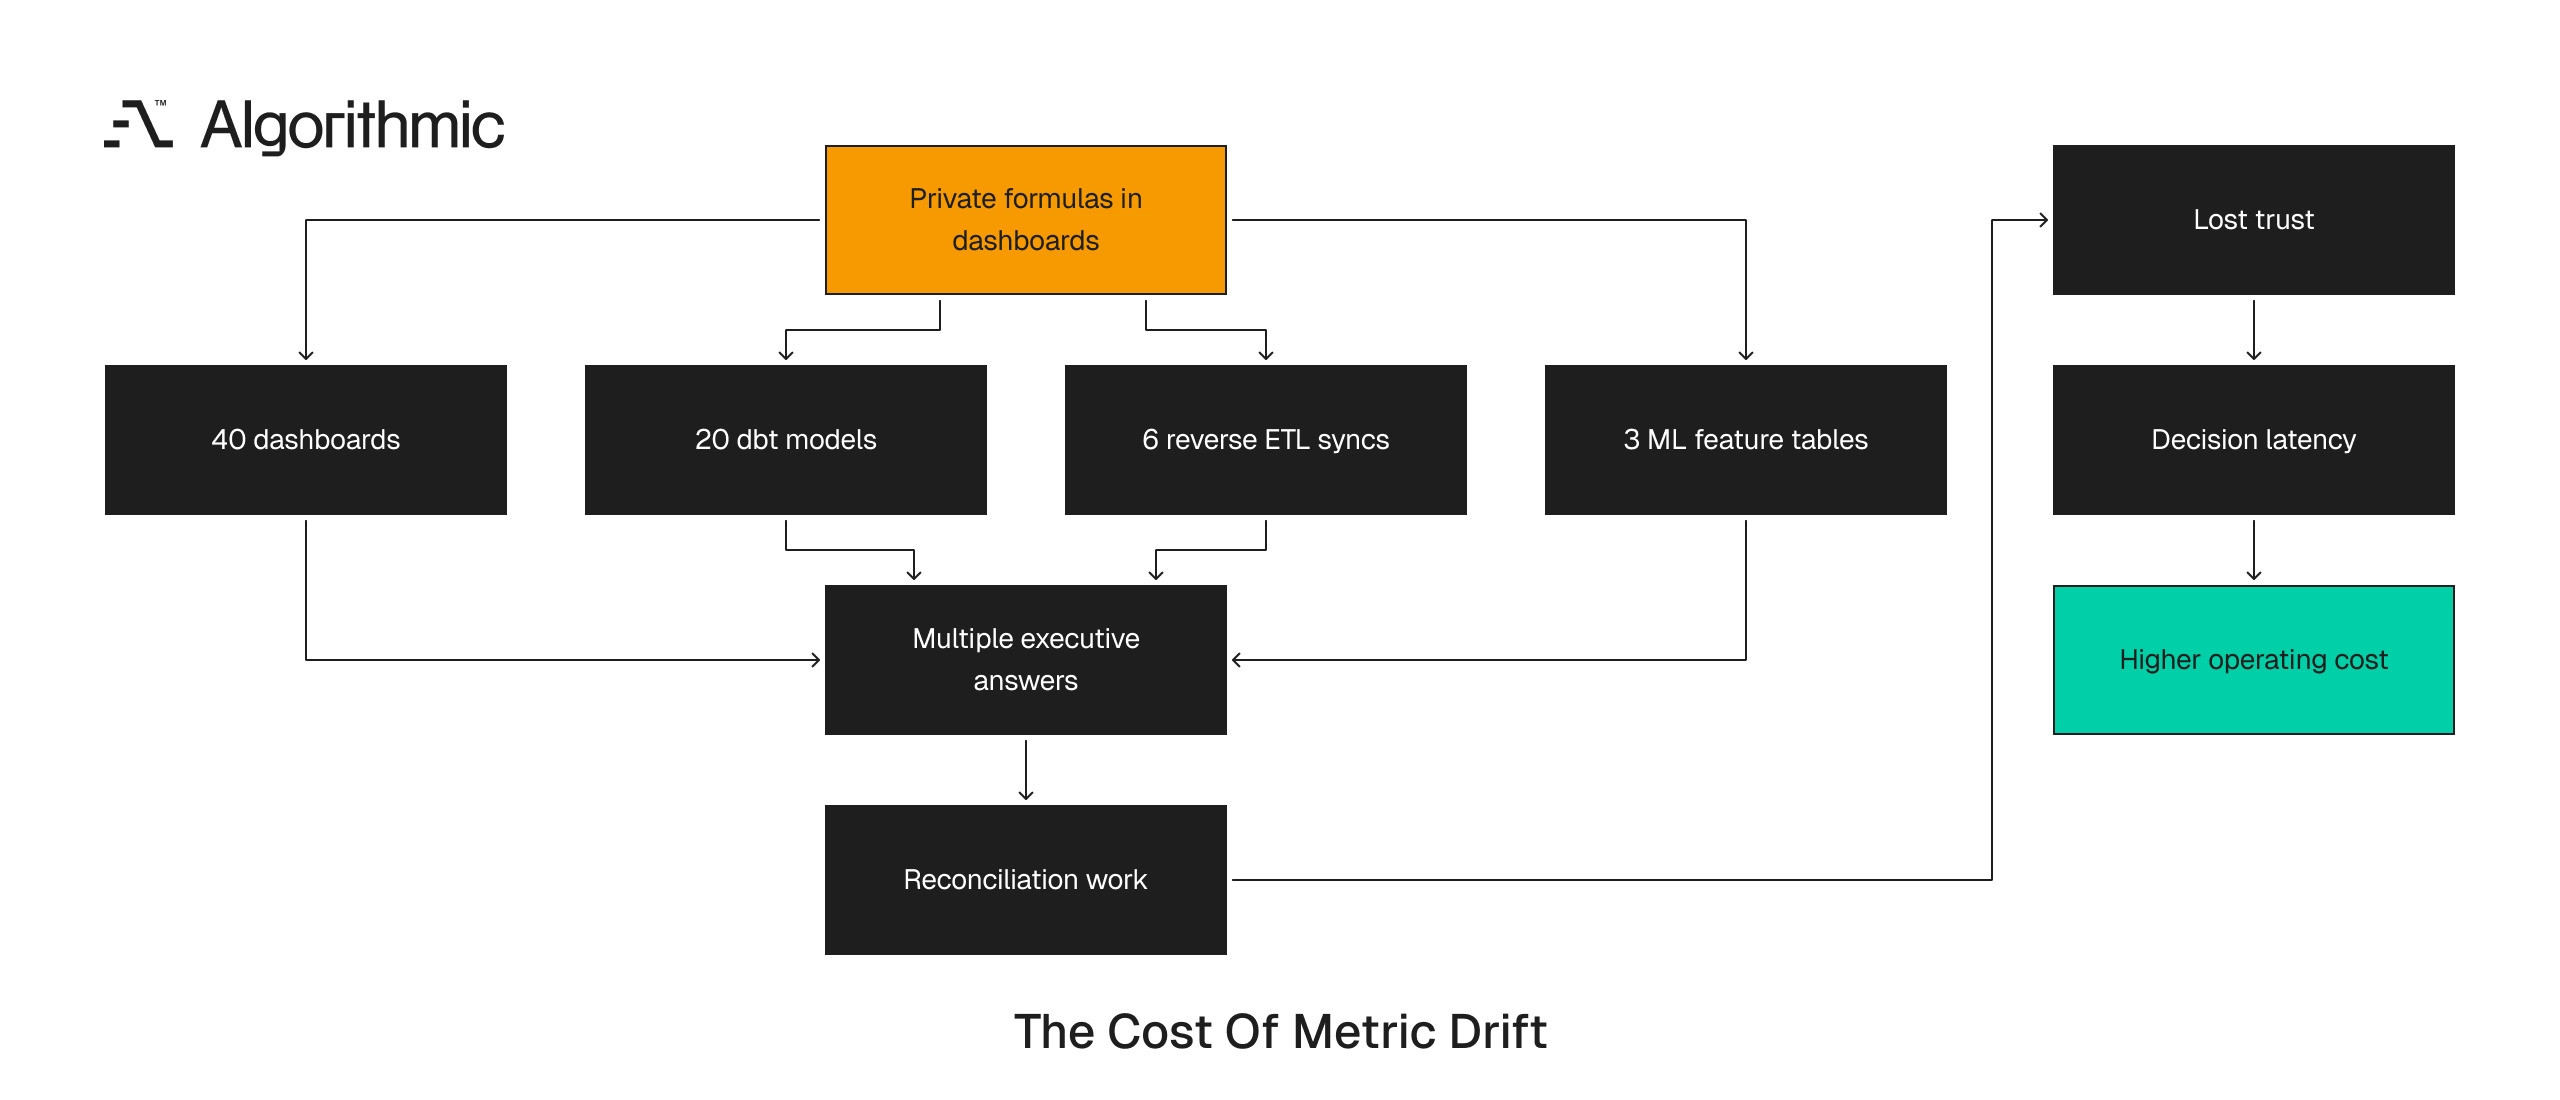
A definition change costs less before consumption begins. It becomes expensive after 40 dashboards, 20 dbt models, 6 reverse ETL syncs, and 3 machine learning feature tables depend on it.
 Click to expand
 One B2B software company rebuilt its executive reporting model after finding four active definitions for retained customer. Finance counted logo retention from paid contracts, customer success counted managed accounts with renewed success plans, product counted tenants with monthly active usage, and growth counted accounts with any login in the last 30 days. Each definition answered a legitimate operating question. The warehouse had a well-formed dim_account table and a well-formed fact_subscription table, so the failure was the absence of a governed retention definition, and reconciliation consumed nine weeks across analytics engineering, RevOps, finance, and customer success.
The team found the issue during a quarterly business review. The CFO reported 91 percent logo retention, customer success reported 96 percent managed-account retention, and product analytics reported 83 percent active-tenant retention for the same period. The CEO stopped the meeting and asked for one number, and the data team paused two roadmap items to rebuild the retention layer. This pattern is not unique to one company, since duplicated definitions cost enterprises real money each year and the same metric carries different meanings across rooms. Query syntax is rarely the limiting factor in those failures, because the strain lives in organizational ownership of the model rather than SQL.
The recovery cost also includes trust. Once executives see three versions of revenue in the same month-end meeting, every future number is questioned, and analytics teams spend cycles defending calculations that should live as governed contracts. The operational cost expands through dependent systems, since reverse ETL sends customer health scores into Salesforce and machine learning feature tables feed churn models. If the retention definition changes without controlled migration, sales teams receive different renewal priorities, customer success leaders challenge model output, and the technical fix becomes an operating-model repair.
The cost also appears in analyst throughput, since a senior analytics engineer can spend 10 to 15 hours per week reconciling revenue, retention, and customer counts, and that time displaces model quality, testing, and new analytical work. The issue reaches finance close, because if month-end reporting requires manual reconciliation across dashboards, close timelines lengthen and executives receive decision data after the operating window has passed. The same issue affects AI use cases, since an internal agent that answers what is churn will reproduce whichever metric it can access, so governed definitions protect the agent from returning contradictory answers across Slack, CRM notes, and BI extracts.
The cost compounds through rework. Analysts revise SQL, BI developers update dashboards, data engineers change reverse ETL mappings, RevOps revises Salesforce fields, and finance rebuilds board materials. A definition change also creates training cost, since each executive assistant, analyst, CSM, and sales manager needs to know which number changed, and without a written release note the same questions return for weeks.
The highest cost appears when teams make decisions from different definitions. Product invests in onboarding changes based on active-tenant retention while finance reports strong logo retention from contract renewals. Both views can be true under their own rules, yet leadership still lacks one governed retention measure for company performance, and that gap slows decisions and weakens accountability. The cost also affects model training, since a churn model trained on one churn definition scores accounts against that label, and if customer success uses a different churn definition, adoption fails. Feature stores inherit the same semantic risks, since a feature named active_days_last_30 needs event rules, identity rules, and bot rules, or the model learns from inconsistent behavior signals.
Semantic layers store logic but ownership gives that logic authority
Tools such as LookML, the dbt semantic layer, MetricFlow, Cube, AtScale, and Power BI semantic models can centralize calculations, but they do not decide which calculation carries authority. A semantic layer can define net_revenue as gross revenue minus refunds and credits, yet finance still needs to own the policy and RevOps needs to approve the booking attribution rule. Product analytics needs to know when to use revenue versus product-qualified revenue, customer success needs to know which revenue measure drives health scoring, and sales operations needs to know which bookings value applies to compensation.
This distinction matters because semantic tooling often arrives after divergence already exists, so the tool becomes a repository for competing formulas unless the operating model changes, and metric logic requires ownership, approval, and change control. Metric logic alone does not solve entity identity and customer definition issues, and traditional ontologies face the same drift pattern when application logic, dashboards, and source systems evolve independently until definitions move away from the central model. Documentation alone does not hold definitions in place, so production systems need enforcement points.
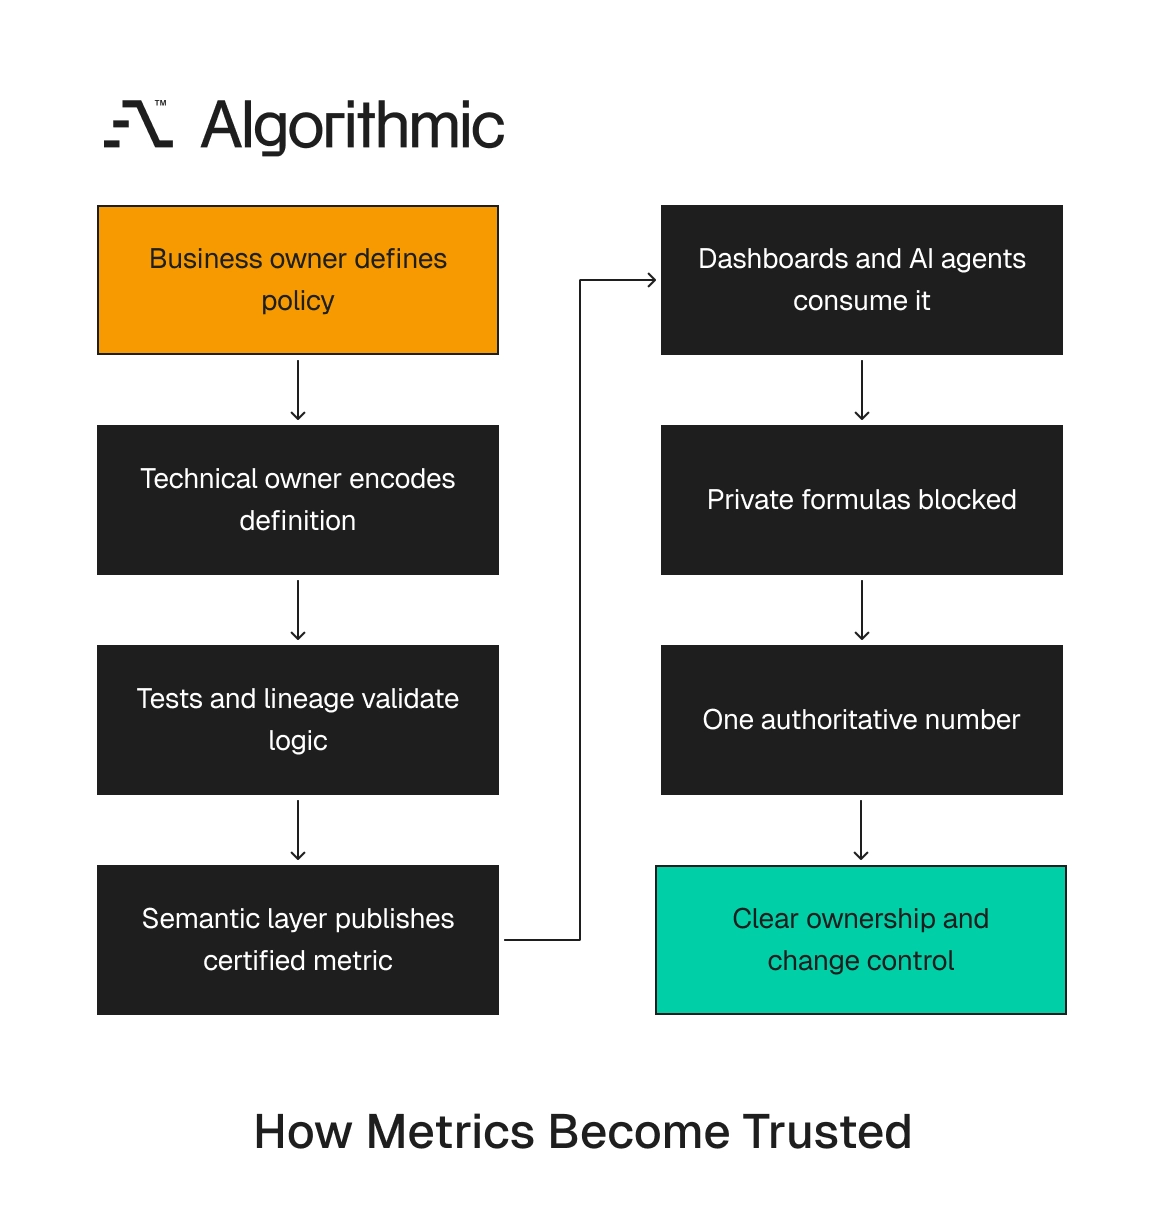
The practical answer is semantic ownership. Each canonical metric and conformed dimension needs one accountable business owner and one accountable technical owner, where the business owner defines policy and the technical owner encodes, tests, versions, and publishes the definition. That split creates accountability without giving one function unilateral control, and it gives the data team a clear decision path when disputes arise. Naming these owners is one part of a wider data platform team structure and ownership question.
 Click to expand
 Ownership must be visible in the tools analysts use, so a metric catalog entry should show the business owner, technical owner, approval date, version, and source models, and analysts should see that information before they use the field. The semantic layer should also block unsafe reuse, so if a user creates a private formula named ARR, the review process stops publication, and exploratory formulas belong in development spaces with clear labels and expiration dates.
Semantic ownership should match decision rights. Finance owns recognized revenue because finance signs off on the ledger, sales operations owns pipeline rules because pipeline drives sales management, product owns activation because activation reflects product value, customer success owns onboarding completion because that team runs implementation, and RevOps owns customer hierarchy because it spans CRM, territories, and account ownership. The technical owner should have release authority over code quality and decide whether the SQL meets testing, lineage, and performance standards, but they do not decide whether credits reduce net revenue. This division prevents two common failures, since business owners cannot publish policy in spreadsheets outside the warehouse and technical owners cannot settle commercial disputes through SQL defaults.
A semantic layer also needs naming discipline. The terms revenue, active, and customer are overloaded, so certified fields should carry precise names such as recognized_revenue_usd, active_paid_customer, and reporting_customer_id. Alias rules help users, so a search for revenue returns approved revenue measures with definitions and owners, and the tool should discourage a generic field that hides policy.
Four controls keep dimensional models stable at scale
A mature warehouse needs controls that bind structure, meaning, and change, and these controls should exist before broad self-service access expands beyond the analytics team. The four controls below are practical and testable, they fit modern warehouse stacks built with Snowflake, BigQuery, Redshift, Databricks, dbt, and BI semantic layers, and none requires a large governance office.
1. Conformed dimensions for shared entities
Conformed dimensions define shared entities once and reuse them across fact tables, and customer, product, geography, account owner, plan, and calendar are the usual starting points. The goal is uniform identity and history, so dim_customer should define the canonical customer key, hierarchy, status, segment, acquisition channel, and effective-dated changes, and each attribute should have a source, owner, and update rule. A customer dimension should also record mapping confidence, since exact matches from billing IDs deserve different treatment from fuzzy matches on domain names, and manual overrides need approval records and expiration dates. Microsoft’s account of standardizing dimensions in a unified data model makes the same point from an enterprise model perspective, since dimension consistency turns separate analytical areas into a shared reporting base.
Calendar dimensions deserve the same discipline, since fiscal periods, week starts, holiday calendars, and quarter-close dates affect every trend line, so a company with US and EMEA revenue teams should not bury fiscal rules inside dashboards. Conformed dimensions need data quality tests for duplicate keys, broken parent-child relationships, invalid status values, and unexpected nulls, and these tests should run before governed metrics publish. The dimension also needs stewardship for manual changes, so when a RevOps manager approves a parent-account override through a ticket or pull request, the warehouse preserves the original source mapping and the approved override.
Conformed product dimensions matter in multi-product companies, since a product family, module, SKU, plan, and feature flag can represent different concepts, so revenue and adoption reports need a shared product hierarchy. Sales territory dimensions also need history, because account ownership changes during territory realignment, so pipeline, bookings, and renewal reports should preserve the owner at the time of the event. Plan dimensions need pricing history, since a plan named Pro can change limits, features, and price over time, so the dimension should record plan version, effective dates, and package rules.
2. Governed metric tables for executive measures
Canonical metrics should be materialized or exposed as governed tables rather than re-derived in every dashboard. For revenue, a governed metric table should include metric name, reporting period, entity key, value, currency, calculation version, source fact tables, exclusion rules, and data freshness timestamp. This structure gives BI tools, notebooks, AI agents, and reverse ETL jobs one reference point, reduces the number of places where policy can drift, and lets analysts query the metric directly without rebuilding the definition. For example, metric_monthly_recurring_revenue should serve the CFO dashboard, the board deck, and the customer health model, and private MRR calculations should fail code review unless they support labeled exploratory analysis.
The table should also carry audit fields such as calculation_version, published_at, approved_by, and source_reconciled_at, which make month-end variance analysis faster and reduce debate over stale extracts. Governed tables should sit close to production transformations, so in dbt that usually means marts with tested YAML metadata and exposures, and in a metric layer that means versioned metric definitions tied to tested model lineage. A metric table should also include reporting grain, since customer-month, contract-line, account-day, and cohort-month answer different questions, and storing the grain in metadata prevents accidental joins that duplicate values.
Performance matters here, so executive dashboards should query governed aggregates instead of raw events when the metric is stable, which cuts query cost and reduces the risk of inconsistent filters. Governed tables also support reproducibility, since a board deck created in March should be reproducible in September, and versioned metric output makes that possible without searching archived spreadsheets. Materialization strategy should follow usage, so daily operational metrics can refresh hourly from billing and product systems while finance-approved monthly revenue refreshes after close and then freezes. A metric table should expose status fields such as draft, certified, deprecated, and retired to give users a clear publication state, and certified metrics should have owners, tests, and release notes.
3. Semantic ownership for each metric and dimension
Every canonical asset needs named owners. The owner of customer can sit in RevOps with technical ownership in analytics engineering, the owner of net revenue retention can sit in finance, and the owner of activation can sit in product. Shared ownership sounds collaborative and often produces delayed decisions, since two directors can debate a metric for three weeks while analysts keep shipping private formulas, so a single accountable owner reduces that delay.
Ownership should include approval rights, change review, exception handling, and metric deprecation, so the technical owner keeps SQL, tests, lineage, and release notes current while the business owner approves policy changes before release. Owners also need a service-level expectation, so a two-business-day review window is reasonable for routine changes to executive metrics, and high-impact changes such as churn redefinition should use scheduled release cycles. Ownership should appear in the data catalog and in the repository, so a YAML file can store owner fields, Slack channel, approval group, and escalation path, and a dashboard description can link to the same metadata. This removes ambiguity during incidents, since if retention drops after a model deployment, analysts know who approves the corrected definition, and if finance rejects a revenue rule, the data team has a documented escalation path.
Ownership also needs succession planning, so when the RevOps owner leaves, the dim_customer approval path should not stop, and the catalog should assign owner groups and named delegates. Technical ownership needs coverage across the stack, since one owner can maintain dbt models while another maintains LookML or Power BI semantic models, and the release path should show both. Business ownership should include training, since a metric owner must explain the rule to analysts and operators and approve examples, edge cases, and release notes.
4. Change control before downstream propagation
Definition changes need the same discipline as API changes. A change to churn definition should include a version number, migration note, sample impact analysis, affected dashboards, affected downstream models, and a release date, and a 5 percent movement in a board metric requires explicit approval and communication before the dashboard changes. Architecture decision records work well for this purpose, since one page is enough to record the decision, context, options considered, accepted definition, owner, effective date, and downstream assets.
The release process should include backtesting, so run the old and new definitions across the prior 12 months and show the movement by segment, region, plan, and customer size. This analysis prevents a common failure mode, since a definition change can move the total metric by 2 percent while moving enterprise retention by 11 percent, and segment-level movement matters when compensation, board reporting, or renewal plans depend on the number. Change control should include consumer notification, so dashboard owners, RevOps, finance, and customer success receive release notes before the metric changes, and the note should state the old value, new value, reason, owner, and date. The process should also include deprecation, so keep the prior version available for a defined period and then remove it, since permanent parallel definitions recreate the original problem.
Change control needs a severity model, so a spelling correction in a description can ship through normal review while a churn definition that changes reported retention needs executive approval. A release calendar reduces surprise, so finance and RevOps should know when metric changes will land, and executive dashboards should avoid definition changes during board packet preparation. Impact analysis should include downstream systems, since a metric can feed Salesforce, Gainsight, Catalyst, HubSpot, a feature store, and a board deck, so the release note should name those systems. Rollback plans also matter, so if a new metric definition fails reconciliation after release, the team needs a clear path to revert that preserves the audit trail.
A definition control matrix for warehouse rebuilds
Analytics leaders need a working artifact, not a glossary with 300 dormant terms. The following matrix is a practical starting point for a warehouse rebuild, semantic layer redesign, or executive reporting reset.
The matrix pairs with the Kimball dimensional modeling techniques, since conformed dimensions are the physical base the governed metrics sit on.
| Domain asset | Canonical definition | Grain | Business owner | Technical owner | Published asset | Change rule |
|---|---|---|---|---|---|---|
| Customer | Legal or commercial entity receiving the product, mapped to one parent account where applicable | Customer-month | RevOps | Analytics engineering | dim_customer | Approval from RevOps and finance |
| Activation | First completed action that delivers the product’s initial promise | Customer-event | Product | Analytics engineering | metric_activation | Product approval with 30-day cohort impact |
| Booking | Signed commercial commitment with effective start date and contracted value | Contract-line | Sales operations | Data engineering | fact_booking | Sales operations and finance approval |
| Net revenue | Recognized revenue after refunds, credits, and tax exclusions | Customer-month | Finance | Analytics engineering | metric_net_revenue | Finance approval and versioned release |
| Retention | Customer retained if active paid contract exists at cohort anniversary | Cohort-month | Finance | Analytics engineering | metric_retention | Finance and customer success review |
| Onboarded | Customer has completed the first-time implementation promise | Customer-event | Customer success | Analytics engineering | metric_onboarded | Customer success approval |
| Active user | Identified user who performs a qualifying product action during the reporting period | User-day | Product | Analytics engineering | metric_active_user | Product approval with event contract review |
| Gross margin | Revenue less approved cost of goods sold categories for the period | Customer-month | Finance | Analytics engineering | metric_gross_margin | Finance approval and ledger reconciliation |
| Pipeline | Open sales opportunity value using approved stage, probability, and close-date rules | Opportunity-week | Sales operations | Data engineering | metric_pipeline | Sales operations approval |
| Support load | Customer support activity counted by approved ticket status, channel, and severity | Customer-week | Support operations | Analytics engineering | metric_support_load | Support operations approval |
This matrix should live near the code, since a Git repository with dbt models, YAML metadata, MetricFlow definitions, and architecture decision records is usually stronger than a detached wiki page, and the artifact should change through pull requests and owner approval. The matrix also separates related concepts, so onboarded, activation, repeat goals, and North Star outcomes remain distinct fields where each answers a different management question. Onboarded measures implementation completion, activation measures first product value, repeat goals measure durable behavior, and the North Star outcome measures customer success at a level that correlates with retention.
The same separation applies to revenue, since bookings, billings, recognized revenue, ARR, MRR, net revenue retention, and gross revenue retention serve different decisions, and combining them under one revenue label creates predictable reporting conflict. The matrix should include examples for contested rules, so for retention include three customer IDs that show renewal, churn, and reactivation, and for revenue include one refund, one credit, and one reseller transaction. Examples keep definitions testable and reduce semantic drift during onboarding, since a new analyst can compare expected outputs to model results before publishing a dashboard.
The matrix should also show data readiness, since a metric can be approved in policy while source data remains incomplete, so a readiness field can show whether the asset is certified, in pilot, or blocked. Add an exception column for known gaps, so EMEA reseller revenue can be excluded until the billing integration ships, and the exception needs an owner and an expiration date. Reference examples should run as tests, so if customer C-1048 churned in April and returned in June, the test should assert expected cohort behavior, and these fixtures keep policy from drifting during refactors. The matrix also helps with onboarding, since new analysts should learn the approved definitions before they receive dashboard publication rights, which prevents private formulas from entering production during the first month.
The 90-day plan for stabilizing business definitions
A warehouse rebuild or semantic layer reset should include a dedicated definition track, treated as part of data warehouse architecture and done while engineering builds the models, tests, and lineage. The plan below works for a mid-market SaaS company with 150 to 1,000 employees, and it assumes one analytics engineering lead, one BI lead, and assigned owners from finance, RevOps, product, and customer success, though smaller teams can reduce scope while keeping the sequence. The work should run on a weekly cadence where each week produces approved definitions, tested models, retired formulas, or documented exceptions, since meetings without artifacts will not fix semantic drift.
Days 1 to 30 inventory definitions and downstream usage
Start with the executive dashboard set, not the full warehouse. List every metric used in board reporting, weekly business reviews, compensation plans, customer health scoring, and investor updates, and for each metric capture the SQL source, BI calculation, owner, refresh cadence, filters, and known disputes. A typical mid-market SaaS company will find 25 to 60 executive metrics, and only 8 to 12 usually need canonical treatment in the first pass, where revenue, bookings, pipeline, customer, activation, churn, retention, usage, and margin are common candidates.
The inventory should include dependency depth, since a metric used by one analyst workbook carries limited risk while a metric used in compensation plans, board reporting, and reverse ETL carries high risk. Interview the business owners during this phase, ask them to define inclusions, exclusions, timing, and edge cases, and capture examples with real account IDs and reporting periods. The output should be a ranked definition backlog where each item shows business impact, technical depth, downstream dependencies, and owner readiness, which prevents the team from spending week three perfecting a low-use metric.
The inventory should also identify duplicate fields, so search BI workbooks for ARR, MRR, churn, active, and customer_count, and count how many formulas exist and where they publish. Use this count as an operating baseline, since a company with 37 MRR formulas has a measurable control problem, and the goal is to retire private formulas as canonical assets go live. The inventory should include query history, since Snowflake, BigQuery, Databricks, and Redshift can show which tables and columns users query, and this evidence helps the team find metrics outside certified dashboards.
Interview questions should be concrete. Ask finance whether credits reduce net revenue, ask sales operations which close date drives pipeline, ask product which events qualify as activation, ask customer success how reinstated customers affect churn, and ask support operations which ticket statuses count toward support load. At the end of day 30, the team should know where definitions live, which formulas conflict, and which owners can make decisions.
Days 31 to 60 publish canonical dimensions and metric tables
Build the conformed dimensions first, since customer, product, plan, calendar, and sales territory usually determine most downstream joins. Then publish governed metric tables for the highest-value measures, and add tests for uniqueness, accepted values, referential integrity, freshness, and reconciliation to source systems such as Salesforce, Stripe, NetSuite, HubSpot, and product event stores. For revenue metrics, require reconciliation to finance within a defined tolerance, where a 0.5 percent variance can be acceptable for daily operational reporting while month-end financial reporting usually requires exact reconciliation to the finance-approved ledger extract.
For customer metrics, reconcile counts across Salesforce, billing, and product systems, document unmatched records, and assign each exception to a source-system owner or a data owner. For product metrics, verify event instrumentation before publishing canonical measures, since a single front-end event rename can break activation reporting, so event contracts should define event names, required properties, identity fields, and allowed values. Publish the first set of definitions with version 1.0, including release notes, example queries, approved dashboard links, and known exclusions, which creates a reference package that analysts can use without private interpretation.
During this phase, create test fixtures for edge cases such as canceled contracts, delayed invoices, merged accounts, trial conversions, reseller deals, and late-arriving events, and run the fixtures in continuous integration with the model tests. Documentation should sit beside the code, since a metric definition stored in Git receives the same review path as the SQL, and that review path gives the definition a production standard. The first release should be narrow, so publish a small number of certified assets and make them reliable, since a half-finished catalog of 80 metrics will not change behavior. The team should also create naming rules during this period, so certified metrics follow a consistent pattern such as metric_<domain>_<name> while deprecated fields carry explicit labels. Set publication standards before dashboards migrate, since a metric should not become certified without owner approval, tests, lineage, freshness rules, and examples, and these standards protect the first release from weak assets.
Days 61 to 90 migrate dashboards and block private definitions
Move executive dashboards to canonical assets. Deprecate workbook-level formulas for governed metrics, add dbt exposures or lineage metadata for critical dashboards, and set review rules that block new private calculations for revenue, retention, activation, and customer count. Publish a change calendar where definition changes have release notes, version numbers, owners, and downstream impact estimates, since this is the point where the data platform becomes a controlled product. Retire the old fields with a clear schedule, keep compatibility views for one or two reporting cycles if needed, and mark them as deprecated in metadata and dashboard descriptions.
Measure adoption during the migration, so track the percentage of executive dashboards using canonical tables and the number of private metric formulas removed from BI workbooks. By day 90, the company should have one approved customer dimension and one approved table for each executive metric, so the remaining work becomes expansion, monitoring, and controlled change, and the most expensive ambiguity has been removed from the reporting base. The migration should end with an executive readout that shows the retired formulas, approved definitions, affected dashboards, and remaining exceptions, which makes definition control visible as an operating improvement. The team should also set a quarterly review, since metrics tied to pricing, packaging, and customer lifecycle change as the business changes, and a scheduled review prevents silent drift.
Dashboard migration should include validation sessions, so the CFO reviews revenue and retention, the CRO reviews bookings and pipeline, the CPO reviews activation and usage, and the COO reviews customer lifecycle and support load, and each owner signs off before the dashboard becomes certified. Access controls can support the migration, so business users retain read access to old dashboards during the transition while publication rights for executive dashboards require certified sources. The team should remove duplicate schedules, since old extracts, email subscriptions, and spreadsheet refreshes often preserve stale definitions, so each retired dashboard should have a communication plan.
Implementation details that make the controls hold
The controls above fail when they remain advisory, and they hold when they are built into code review, deployment, and dashboard certification, so the warehouse needs enforcement points where private definitions are stopped. In dbt, store owner metadata in YAML, add tests for accepted values, uniqueness, referential integrity, freshness, and relationship coverage, and use exposures to map governed models to dashboards and downstream applications. In Looker, restrict certified fields to governed views, require content validation before merging LookML changes, and use naming rules that separate certified metrics from exploratory measures.
In Power BI, use certified semantic models for executive reporting, restrict dataset owners for finance, revenue, and retention models, and publish deprecated field warnings before removing old measures. In Tableau, publish governed data sources for executive dashboards, limit workbook-level calculations for certified metrics, and use data source descriptions to point analysts to the approved table and owner. Reverse ETL requires the same control, so a customer health score sent to Salesforce should include metric version and calculation timestamp, since sales and customer success teams need to know when a score changes because a definition changed.
AI and natural-language analytics require tighter control. A chatbot can answer questions from the semantic layer, the warehouse, or dashboard metadata, so it should use certified metrics for executive questions and refuse ambiguous terms. The refusal should be specific, so if a user asks for revenue, the system asks whether the user needs bookings, billings, recognized revenue, ARR, or MRR, which protects executives from blended measures.
Monitoring should include semantic drift checks, so count new workbook formulas using governed metric names and flag SQL that references raw revenue columns outside approved models. This monitoring does not need a large platform, since a scheduled script can scan BI metadata, dbt artifacts, and query history, and the output can be a weekly exception list for analytics engineering. CI checks should enforce naming rules, so a pull request that creates arr outside the approved metric path fails, and a model referencing raw billing fields for executive revenue requires review.
Lineage should include non-BI consumers, since reverse ETL jobs, notebooks, ML pipelines, spreadsheet exports, and AI retrieval indexes all consume definitions, so the catalog should show these dependencies. Freshness monitoring should align with business use, so a daily executive dashboard needs a clear freshness threshold while a month-end finance table needs close status and ledger reconciliation status. Incident response should include definition review, so if a metric moves sharply after deployment, the team checks policy, data quality, and source changes, and the incident record names the owner and affected version. Metadata should be queryable, so analysts can ask which certified metrics depend on fact_subscription, which shortens migration planning and incident response.
Common failure modes during definition control
Definition programs fail in predictable ways, usually from scope, ownership, or weak enforcement, and these risks should be managed during the first 90 days. The first failure mode is glossary expansion, where teams create hundreds of definitions in a catalog and do not connect them to production assets, so a glossary without code, tests, and owners becomes archive material. The second failure mode is committee ownership, where five functions approve a metric and no person can make the final decision, so the process produces meetings while private formulas continue.
The third failure mode is certification without migration, where teams publish a certified revenue metric and leave ten dashboards on old formulas, so users keep using the dashboards they know. The fourth failure mode is missing examples, where a definition says active paid customer and omits reinstatement, grace periods, and contract gaps, so analysts make their own decisions during dashboard builds. The fifth failure mode is weak deprecation, where old fields remain available with similar names, so users select the wrong field because both appear in the BI tool. The sixth failure mode is source-system mismatch, where Salesforce, Stripe, NetSuite, and product telemetry disagree, so the warehouse needs source precedence rules and exception owners. Each failure has a direct control, so keep scope small, assign one owner, require migration, write examples, remove old fields, and define source precedence.
How this changes the role of analytics engineering
Analytics engineering teams often inherit the semantic problem because they own the transformation layer, so they need authority to stop publication when definitions are unresolved and a decision path that does not force them to settle business policy alone. The analytics engineering lead should own model quality, including tests, lineage, materialization, naming, performance, and release notes, and reject ambiguous definitions before they enter production. Business owners should own policy, so finance decides revenue rules, product decides activation rules, and RevOps decides account hierarchy rules.
This operating model changes backlog planning, so a metric ticket should not enter implementation without an owner and definition, and a dashboard request should identify certified sources before development starts. It also changes review meetings, so the data team brings evidence, examples, and impact analysis while the business owner approves the rule. The result is faster delivery after the first quarter, since analysts stop re-litigating customer count, BI developers stop rebuilding revenue logic, and engineers spend more time on production quality and less time on reconciliation.
Direct action for analytics engineering and BI leaders
Before adding another dashboard or semantic layer, audit the 10 metrics that appear in executive reporting. For each metric, identify the business owner, technical owner, canonical table, grain, exclusion rules, time attribution rule, and downstream dependencies, and if any field is blank, pause new self-service expansion for that domain and close the definition gap in code. Start with the metrics that drive money and executive decisions, so revenue, bookings, retention, churn, customer count, activation, pipeline, margin, and product usage receive priority, since these numbers appear in board decks, compensation plans, renewal forecasts, and investor conversations.
Build the conformed dimensions and governed metric tables first, then expand access, since a warehouse earns trust when its definitions survive month-end close, board review, and operational use. The work is practical and finite, so most companies can stabilize the first 8 to 12 executive metrics within one quarter, and the result is fewer reconciliations, faster reporting cycles, and greater confidence in the numbers used to run the company.
Dimensional modeling still belongs at the center of analytical warehouse design, since it gives structure, performance, and historical depth, and it needs governed meaning above the physical model. A star schema can answer a query correctly and still return the wrong management number, so the fix is explicit business policy encoded, owned, tested, versioned, and published rather than another dashboard layer. The companies that do this work make reporting calmer, so month-end meetings focus on decisions instead of definitions and board materials rely on numbers that match the systems used to run the business.
Algorithmic builds data analytics and business intelligence systems with governed definitions, conformed dimensions, and change control so one metric returns one number across every room. Start a conversation if your finance, product, and sales teams keep reporting different numbers from the same warehouse.