The NBA produces a very large volume of structured data. Each team plays eighty-two regular season games. You can find play-by-play data and shot-level tracking too. Player movement data is recorded at sub-second intervals. Public injury reports are also publicly available. Detailed box scores get updated in real time.
This data abundance creates an opportunity and a problem together. Enough signal exists to model game outcomes with meaningful precision. The betting market stays efficient, and to not forget that the same data is available to every bettor. The same data is available to every syndicate. The same data is available to every quantitative fund. Publicly available statistics are already priced in. Even advanced ones are already priced in. By the time most bettors act, prices match.
We built a platform that finds edge in the contextual features the market underweights. Travel fatigue on back-to-back games with cross-country flights. Lineup chemistry shifts when rotation players absorb minutes from injured starters. Momentum captured through rolling efficiency metrics that reveal performance trends before win-loss records reflect them. The system fuses over 3,000 engineered features across moneyline and point spread markets. It also fuses over/under features, and it delivers 8 to 15% measured ROI. Model refresh stays under one minute, and outputs remain explainable for each prediction.
Why NBA betting is an engineering problem
Some of the characteristics of the NBA betting market shaped every architecture choice we made. Lineup changes and injury downgrades often surface between morning shootaround and tip-off. Those changes sometimes show up within the final hour before game time. A model using yesterday’s projected lineup is already stale now. We needed ingestion pipelines to detect, process, and re-score predictions in real time. Our target was source-to-prediction in under sixty seconds.
We engineer more than 3,000 features from raw NBA feeds. These cover individual player performance and team-level dynamics. They also use context like travel, fatigue, and venue. The work adds cross-feature interactions across these signals. Managing this space prevents overfitting and keeps models interpretable. You also identify which features add real predictive value. This is a data engineering challenge as much as modeling. NBA lines rank among the sharpest in sports. The margin for profitable prediction is narrow. It shifts as market participants trade on information. A model profitable last month may degrade this month. It degrades when the features it relies on are absorbed. Those features get reflected in market pricing and continuous monitoring is required. Retraining is also required for operations.
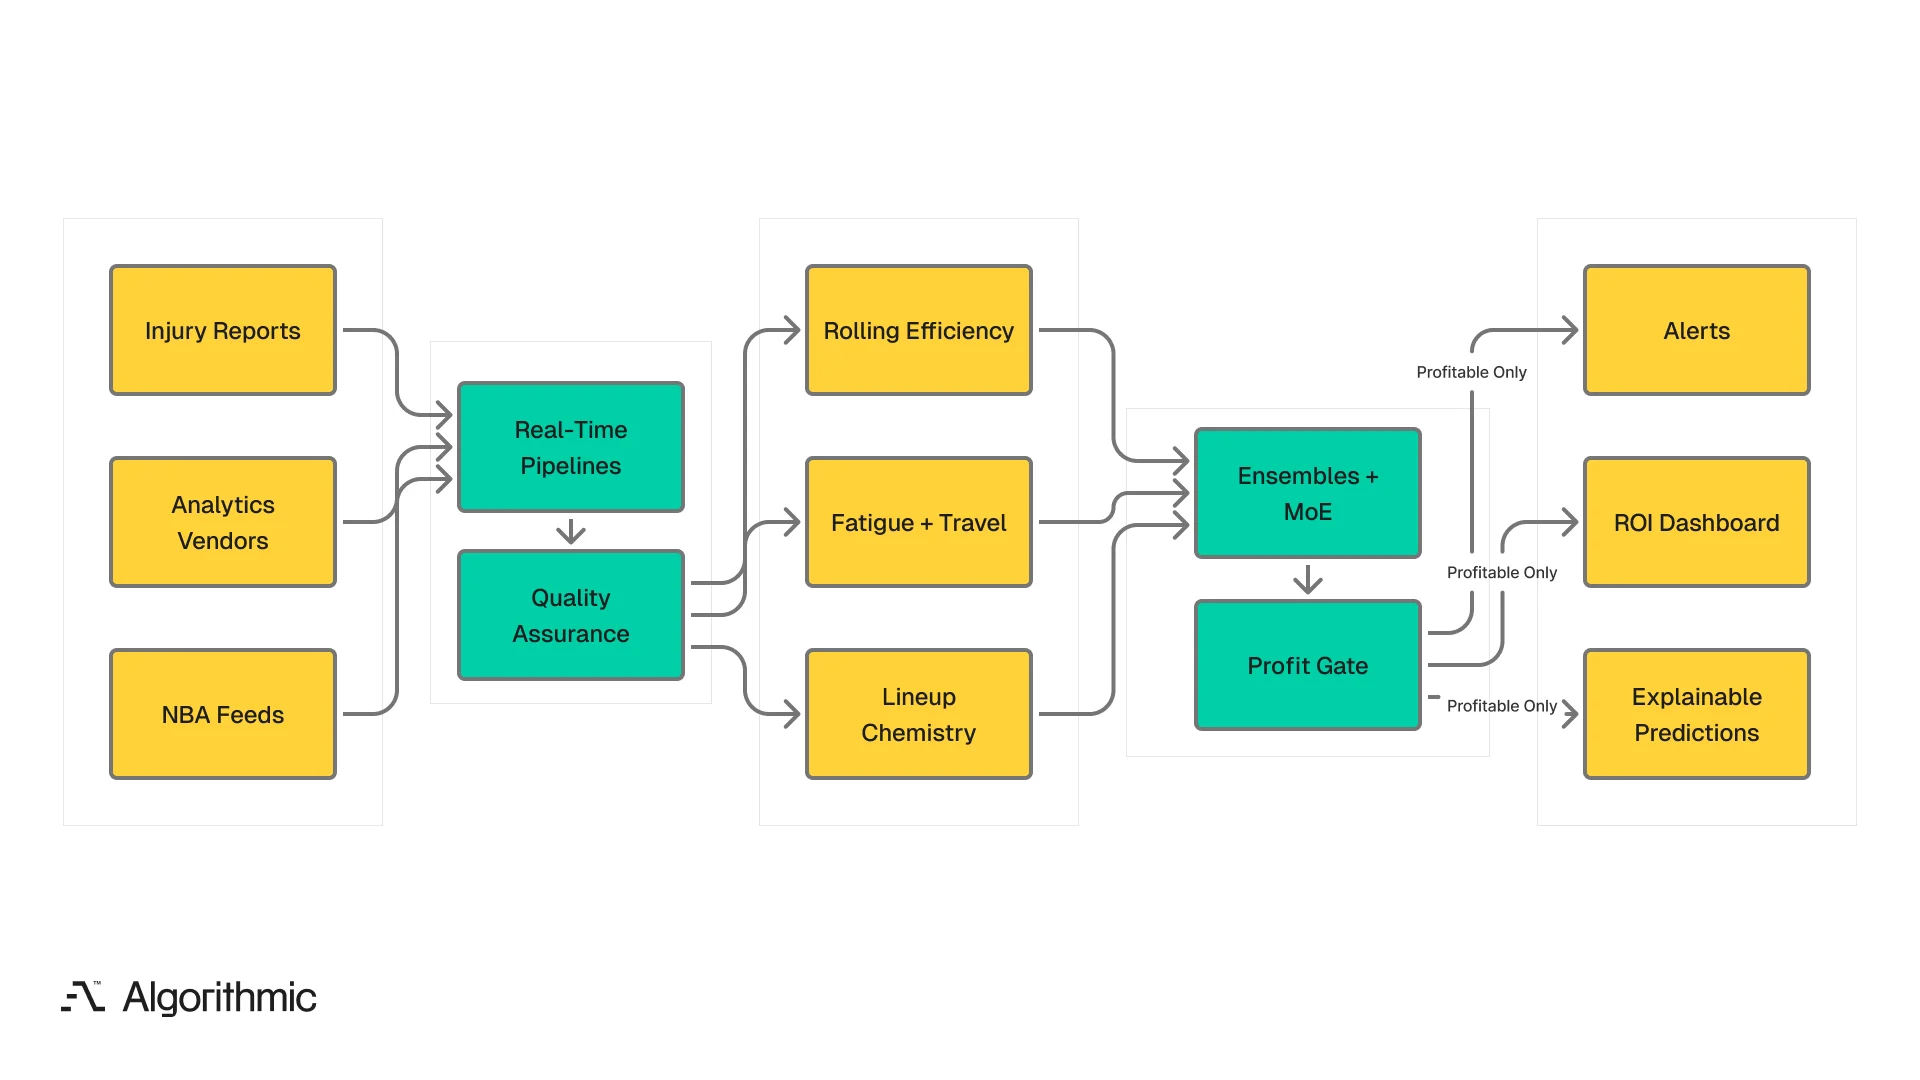
The platform follows a six-stage pipeline from real-time ingestion through profit-gated deployment and explainable decision support.
 Click to expand
 Data infrastructure
The data infrastructure is built around three operational priorities.
- Real-time ingestion pipelines pull from official NBA feeds. They also use premium analytics vendors with low latency delivery. Lineup changes and injury report updates flow in. Live game statistics enter the system within seconds. This happens after publication, without noticeable delay.
- Automated quality assurance sits between ingestion and feature engineering. The QA layer validates incoming data against expected schemas, flags statistical anomalies (a player suddenly listed at a position they have never played, a box score with impossible totals), and prevents data quality issues from propagating downstream. We built this layer after discovering that even premium data feeds occasionally deliver malformed records - and a single bad input can cascade through 3,000+ features.
- Containerised compute runs ingestion, feature engineering, model training, and inference as independent services that scale, update, and roll back without affecting the others. During high-volume periods - playoff rounds, trade deadline week - we scale inference capacity independently of training infrastructure.
Feature engineering: where we found edge
The 3,000+ feature set spans three categories. The contextual features - travel, fatigue, chemistry - provide our primary differentiation from models operating on publicly available statistics.
Shot-level and lineup analytics
We fuse individual player statistics with lineup pairing data to model real-time chemistry effects. A player’s shooting efficiency changes depending on who else is on the floor. We compute two-player and three-player combination statistics that capture these interaction effects, updating as rotation patterns shift through the season. A starting point guard paired with a stretch five produces different spacing - and different outcome probabilities - than the same guard paired with a traditional centre. Our lineup features model these configurations at a granularity that aggregate player statistics miss.
Fatigue and travel modelling
We built a fatigue index that tracks the cumulative physical toll of the NBA schedule at the individual player level. The index incorporates four weighted components:
- Back-to-back detection applies baseline fatigue weighting to games played on consecutive days.
- Cross-country flight weighting compounds fatigue based on travel distance and direction.
- Compressed schedule scoring assigns the highest fatigue values to stretches of three games in four nights across multiple time zones.
- Individual minutes load differentiates between a star logging 38 minutes per game and a rotation player logging 18 on the same schedule.
The index operates at the player level, not the team level. This distinction matters since team-level fatigue averages obscure the individual variation that drives game outcomes.
Rolling efficiency metrics
Team-level performance computed on rolling windows (5-game, 10-game, 20-game) captures momentum and trend shifts before they appear in season-long aggregates. A team on a 7-game winning streak with declining offensive efficiency over the last 5 games presents a different risk profile than one with stable or improving metrics - even though the win-loss record looks identical. We detect this divergence between surface-level record and underlying performance trajectory, and the models weight it accordingly.
Modelling stack
The modelling stack combines three model families, each serving a specific function in the prediction pipeline:
- XGBoost, random forests, and ensemble stacks provide the primary prediction engine. These methods handle the heterogeneous feature space (continuous, categorical, temporal) and produce calibrated probability estimates. We use stacking to combine models trained on different feature subsets and market types.
- Mixture of Experts (MoE) deploys multiple specialist models - each trained on different feature subsets or market types (moneyline, spread, over/under). A gating mechanism weights their contributions based on the current game context. A model trained primarily on travel and fatigue features receives higher weighting for a team on the third game of a west coast road trip. A lineup-chemistry specialist receives higher weighting when a key rotation player returns from injury.
- Neural feature learners capture nonlinear interactions that tree-based models miss. These are effective at modelling the complex relationship between lineup composition, opponent matchup, and venue - interactions with too many dimensions for explicit feature engineering.
Hyperparameter search runs across distributed GPU infrastructure, evaluating thousands of configurations. The tuning process optimises for expected value against market lines - not prediction accuracy in isolation. A model configuration that improves accuracy by 0.5% but reduces expected value gets discarded.
Profit-driven monitoring and deployment
Every model candidate passes through a profitability gate before reaching production. We evaluate candidates through backtesting against historical betting lines and paper trading against current lines. Only models demonstrating positive expected value across a statistically significant sample deploy.
Once in production, the monitoring system tracks three dimensions continuously:
- ROI tracking segments profitability by bet type (moneyline, spread, over/under), by team, by conference, and by time horizon (daily, weekly, monthly, season). This granularity identifies which model segments generate returns and which underperform. We track model-to-market edge specifically - how much value our predictions capture above the closing line.
- Performance alert thresholds flag degradation before it impacts bankroll. If a specific market segment drops below its expected return band, the system alerts operators and can automatically reduce exposure. We calibrated these thresholds using historical drawdown patterns to distinguish normal variance from genuine model decay.
- Explainable predictions carry context with every recommendation - the top contributing features, historical precedent for similar game profiles, and the model’s confidence interval. Our users - professional bettors and quantitative funds - need to understand the rationale behind each recommendation to make informed allocation decisions.
Sub-minute prediction refresh
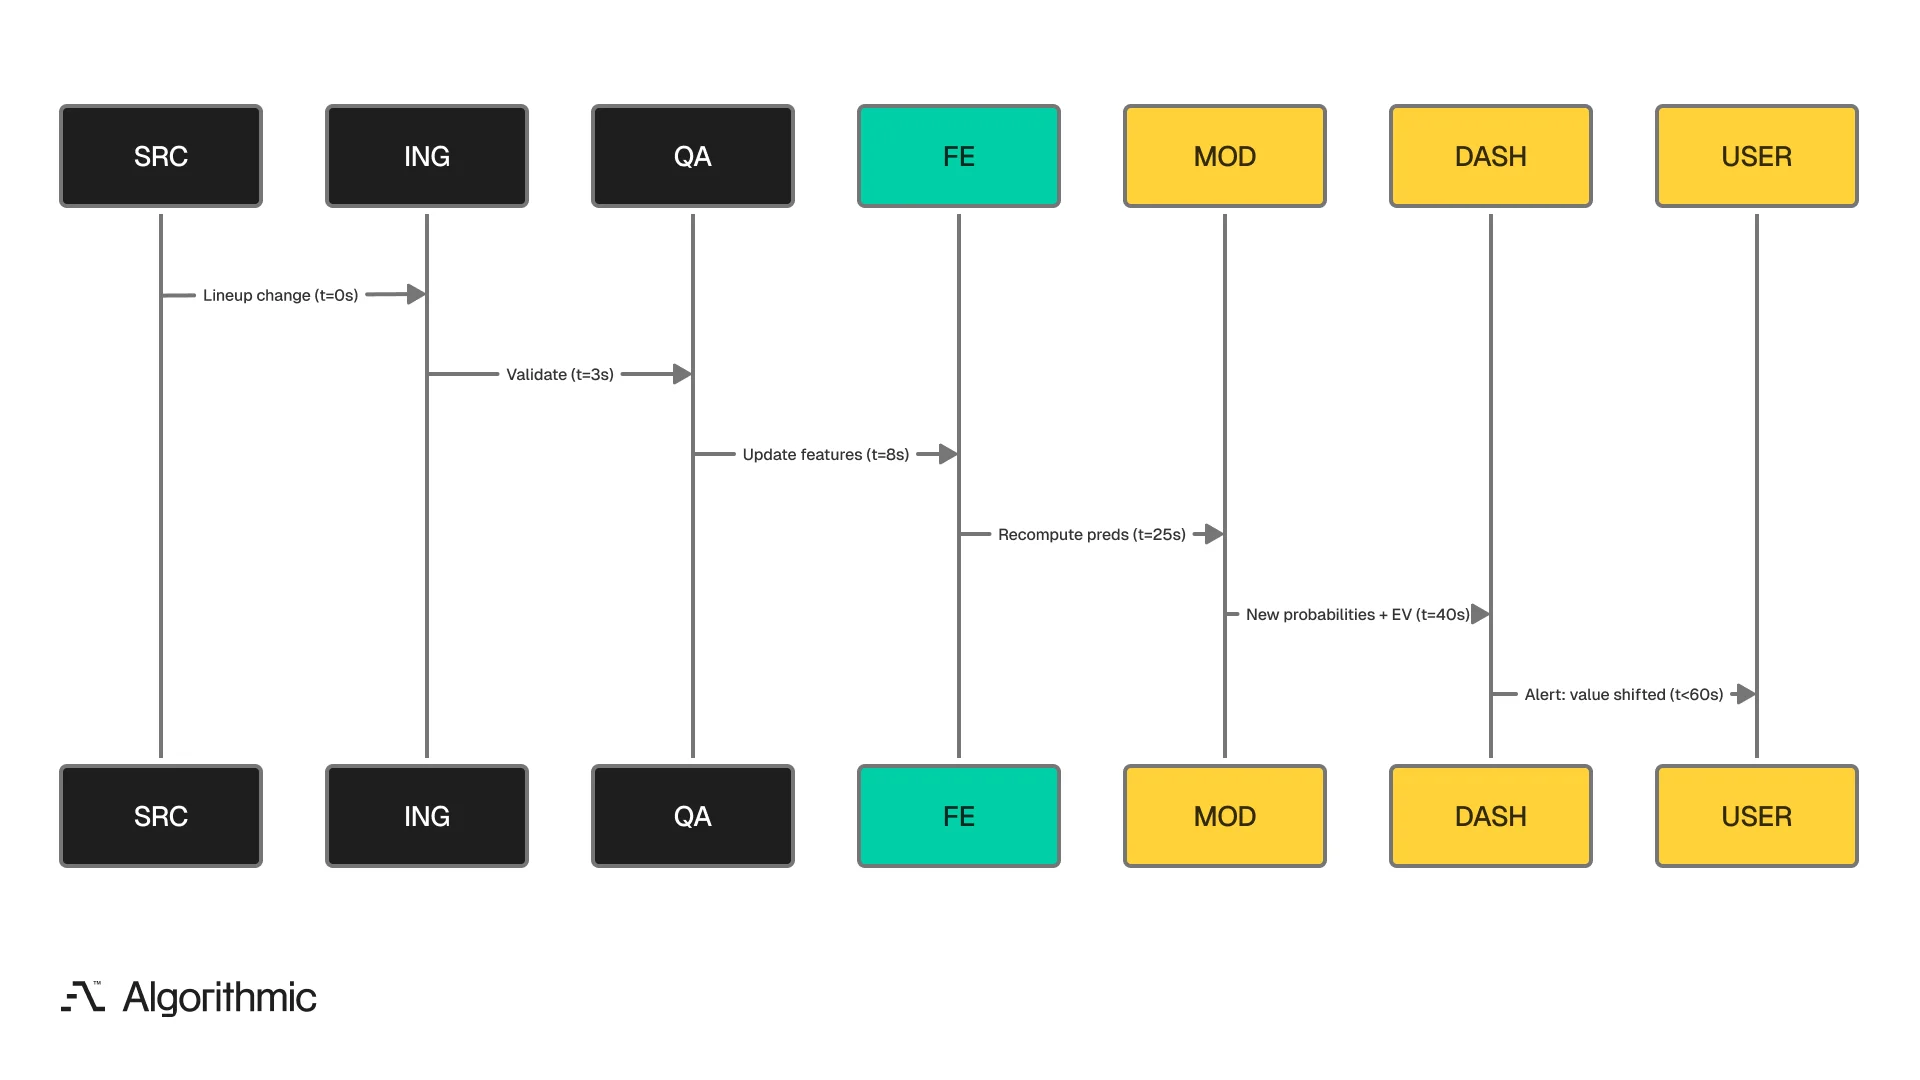
The refresh cycle - from data source event to updated prediction in the dashboard - completes in under sixty seconds. This operational requirement drove many of our infrastructure decisions. When a lineup change publishes, the ingestion pipeline picks it up within seconds. The QA layer validates the update. The feature engine recomputes every affected feature - lineup chemistry, fatigue index adjustments, matchup interaction updates. The production model re-scores the game. Updated probabilities and expected values push to the dashboard. The user receives an alert if the line value shifted meaningfully.
The full cycle from a data source event to an updated prediction in the user’s dashboard completes in under sixty seconds.
 Click to expand
 What we delivered
| Metric | Result |
|---|---|
| ROI | 8-15% across moneyline, spread, and over/under markets |
| Feature engineering | Over 3,000 contextual features from raw NBA feeds |
| Model refresh | Sub-minute: source event to updated prediction in under 60 seconds |
| Explainability | Feature attribution, confidence intervals, and historical precedent per prediction |
| Infrastructure | Cloud-native, containerised, independently scalable services |
| Monitoring | Real-time profitability tracking with automated exposure reduction on degradation |
| User base | Professional bettors and quantitative funds |
What this work represents
NBA prediction at this level is a systems engineering challenge. The data is available and even the statistical methods are well-understood. The difference between a model that produces interesting analysis and one that produces measured financial returns comes down to engineering execution - real-time ingestion, contextual feature engineering at scale, profit-gated deployment discipline, and operational monitoring that catches degradation before it costs capital.
The same architecture - high-dimensional contextual features, sub-minute refresh, profit-gated deployment, explainable outputs - applies wherever predictions must generate financial value in efficient markets. These include sports, finance, commodity trading, demand forecasting in competitive retail and much more.
We build prediction systems where the success criterion is measured returns and the data landscape rewards serious engineering. If your domain fits that description, we are worth a conversation.
This system was built through Algorithmic’s predictive analytics practice, with data infrastructure engineered for sub-minute refresh cycles and real-time feature recomputation at scale.